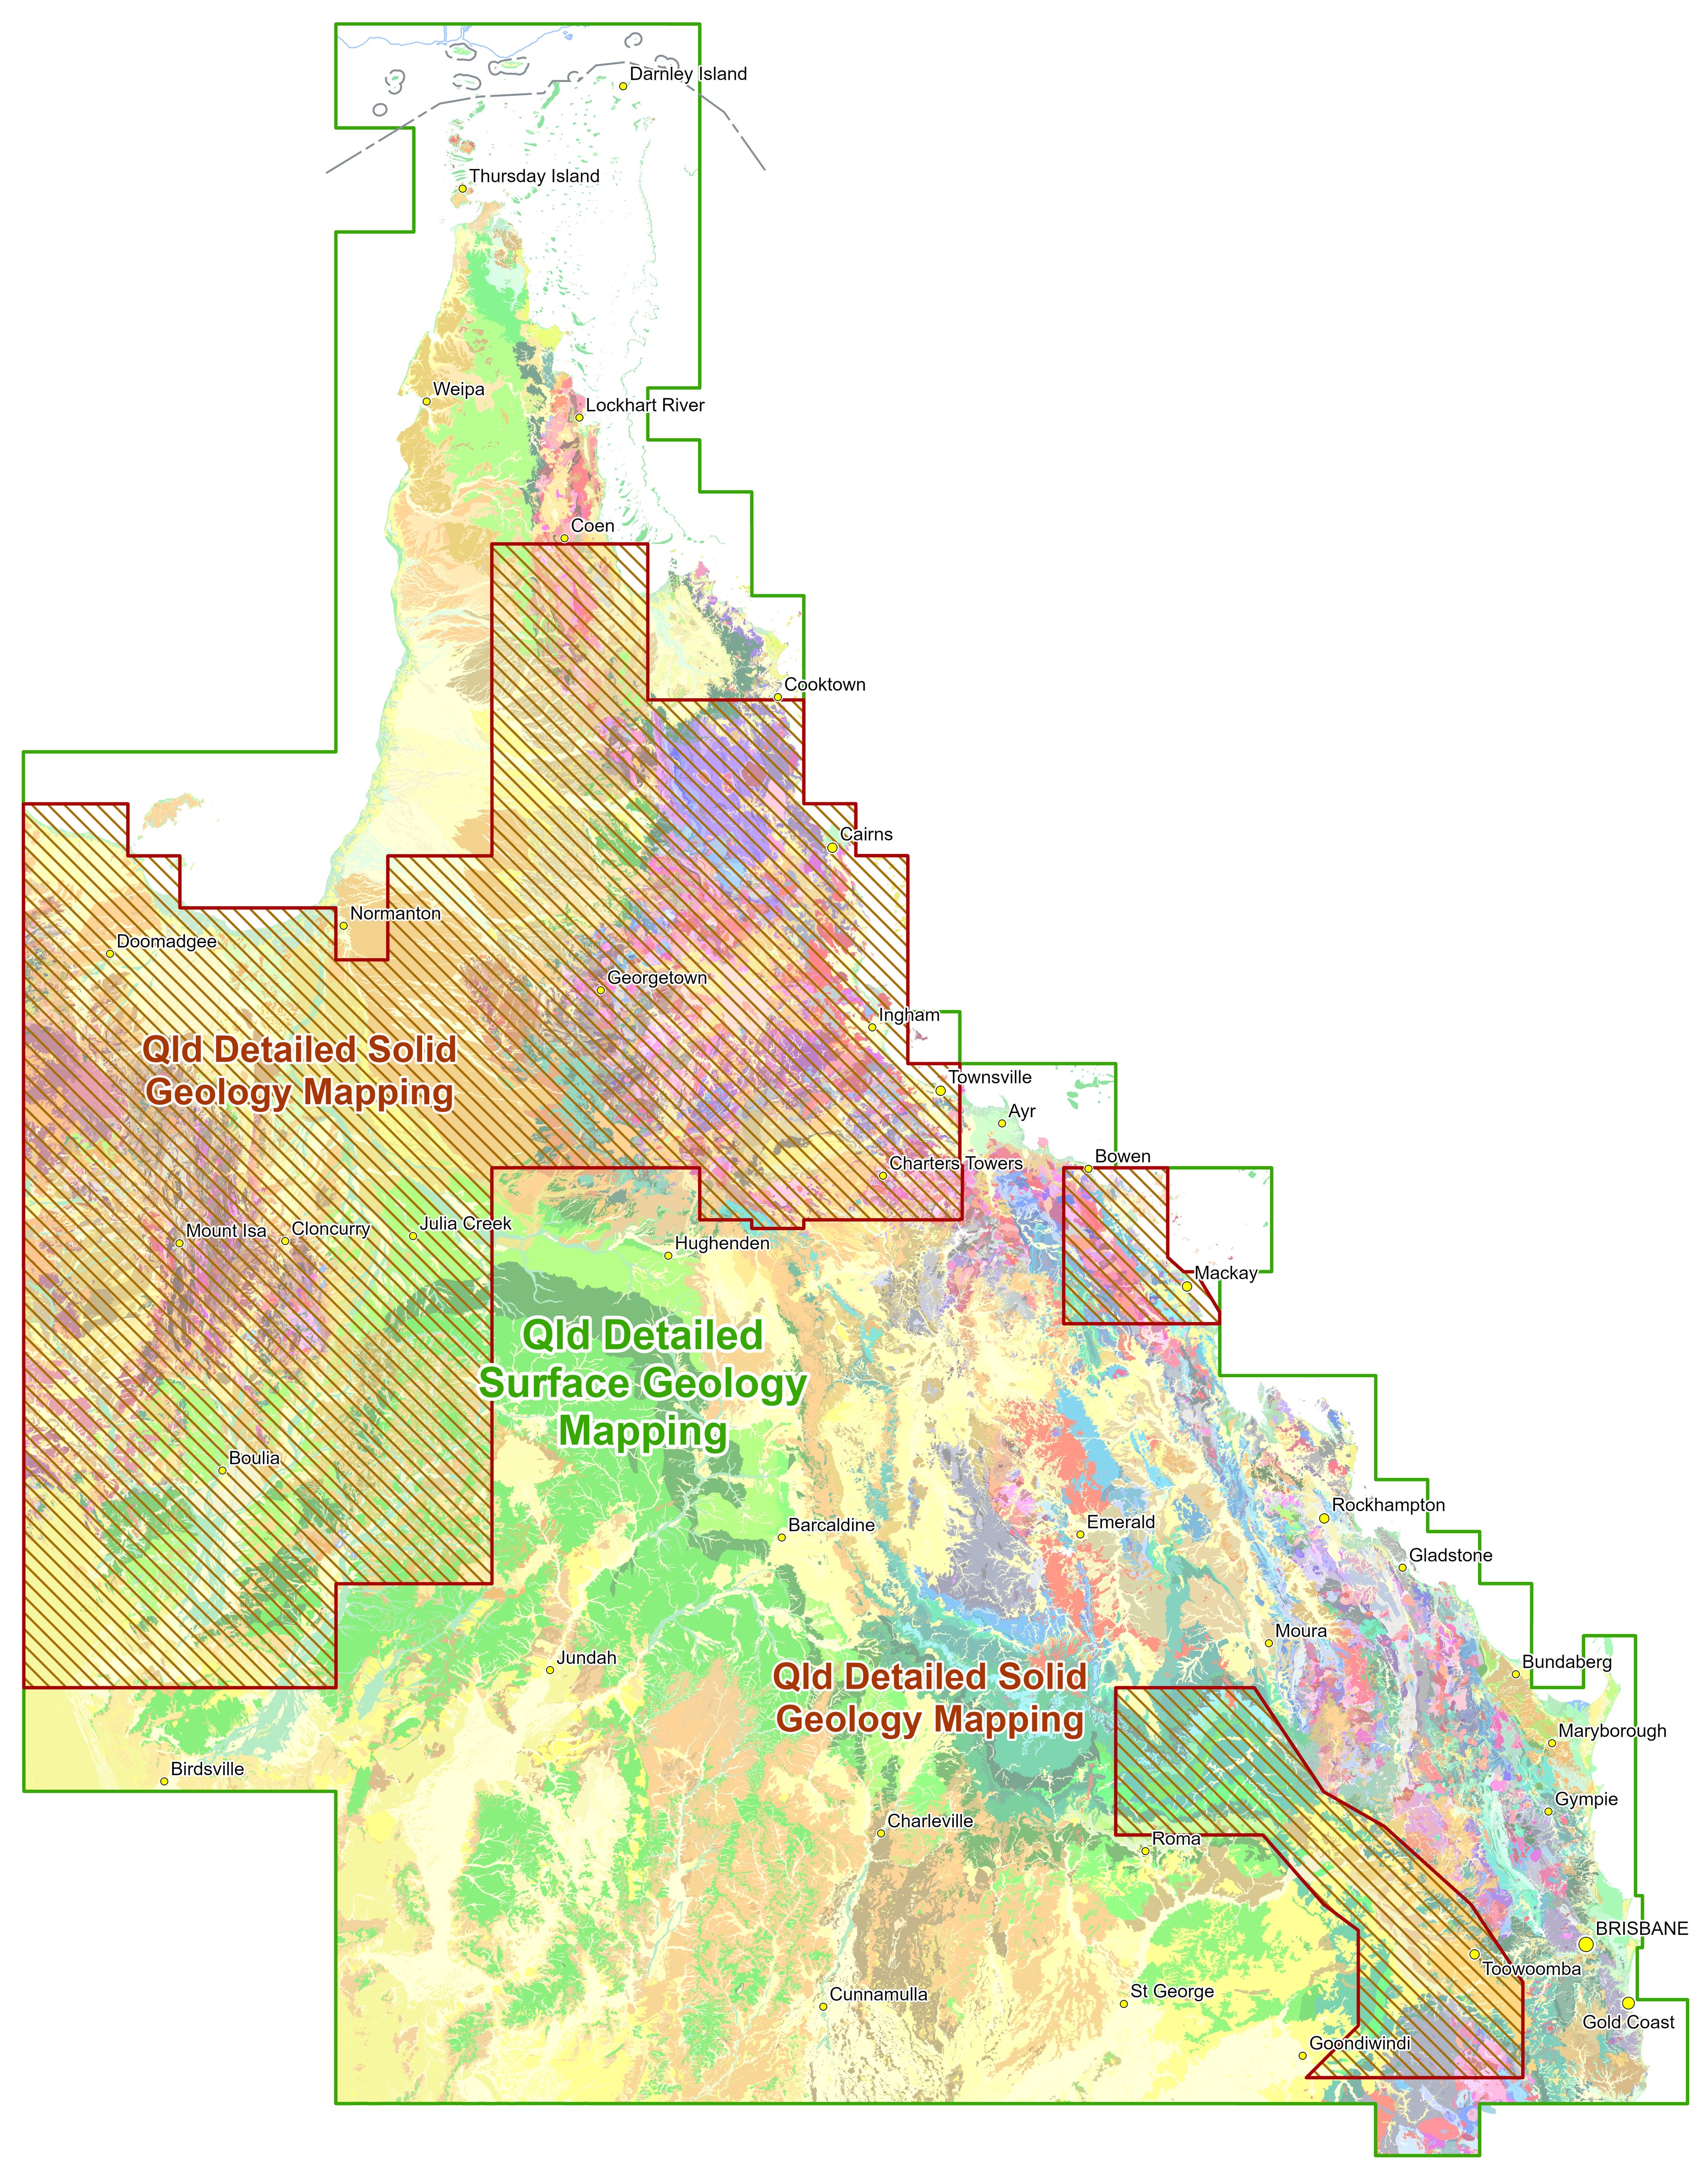
This document describes the July 2026 update of the Queensland Detailed Geology dataset, now available for viewing in the GeoResGlobe (georesglobe.information.qld.gov.au) and download from the Queensland Spatial Catalogue (qldspatial.information.qld.gov.au). Online map services can be discovered from the Queensland Spatial Portal (spatial.information.qld.gov.au). Further details on updates in this release are listed below.
Detailed Surface and Solid Geology Data extents—July 2026
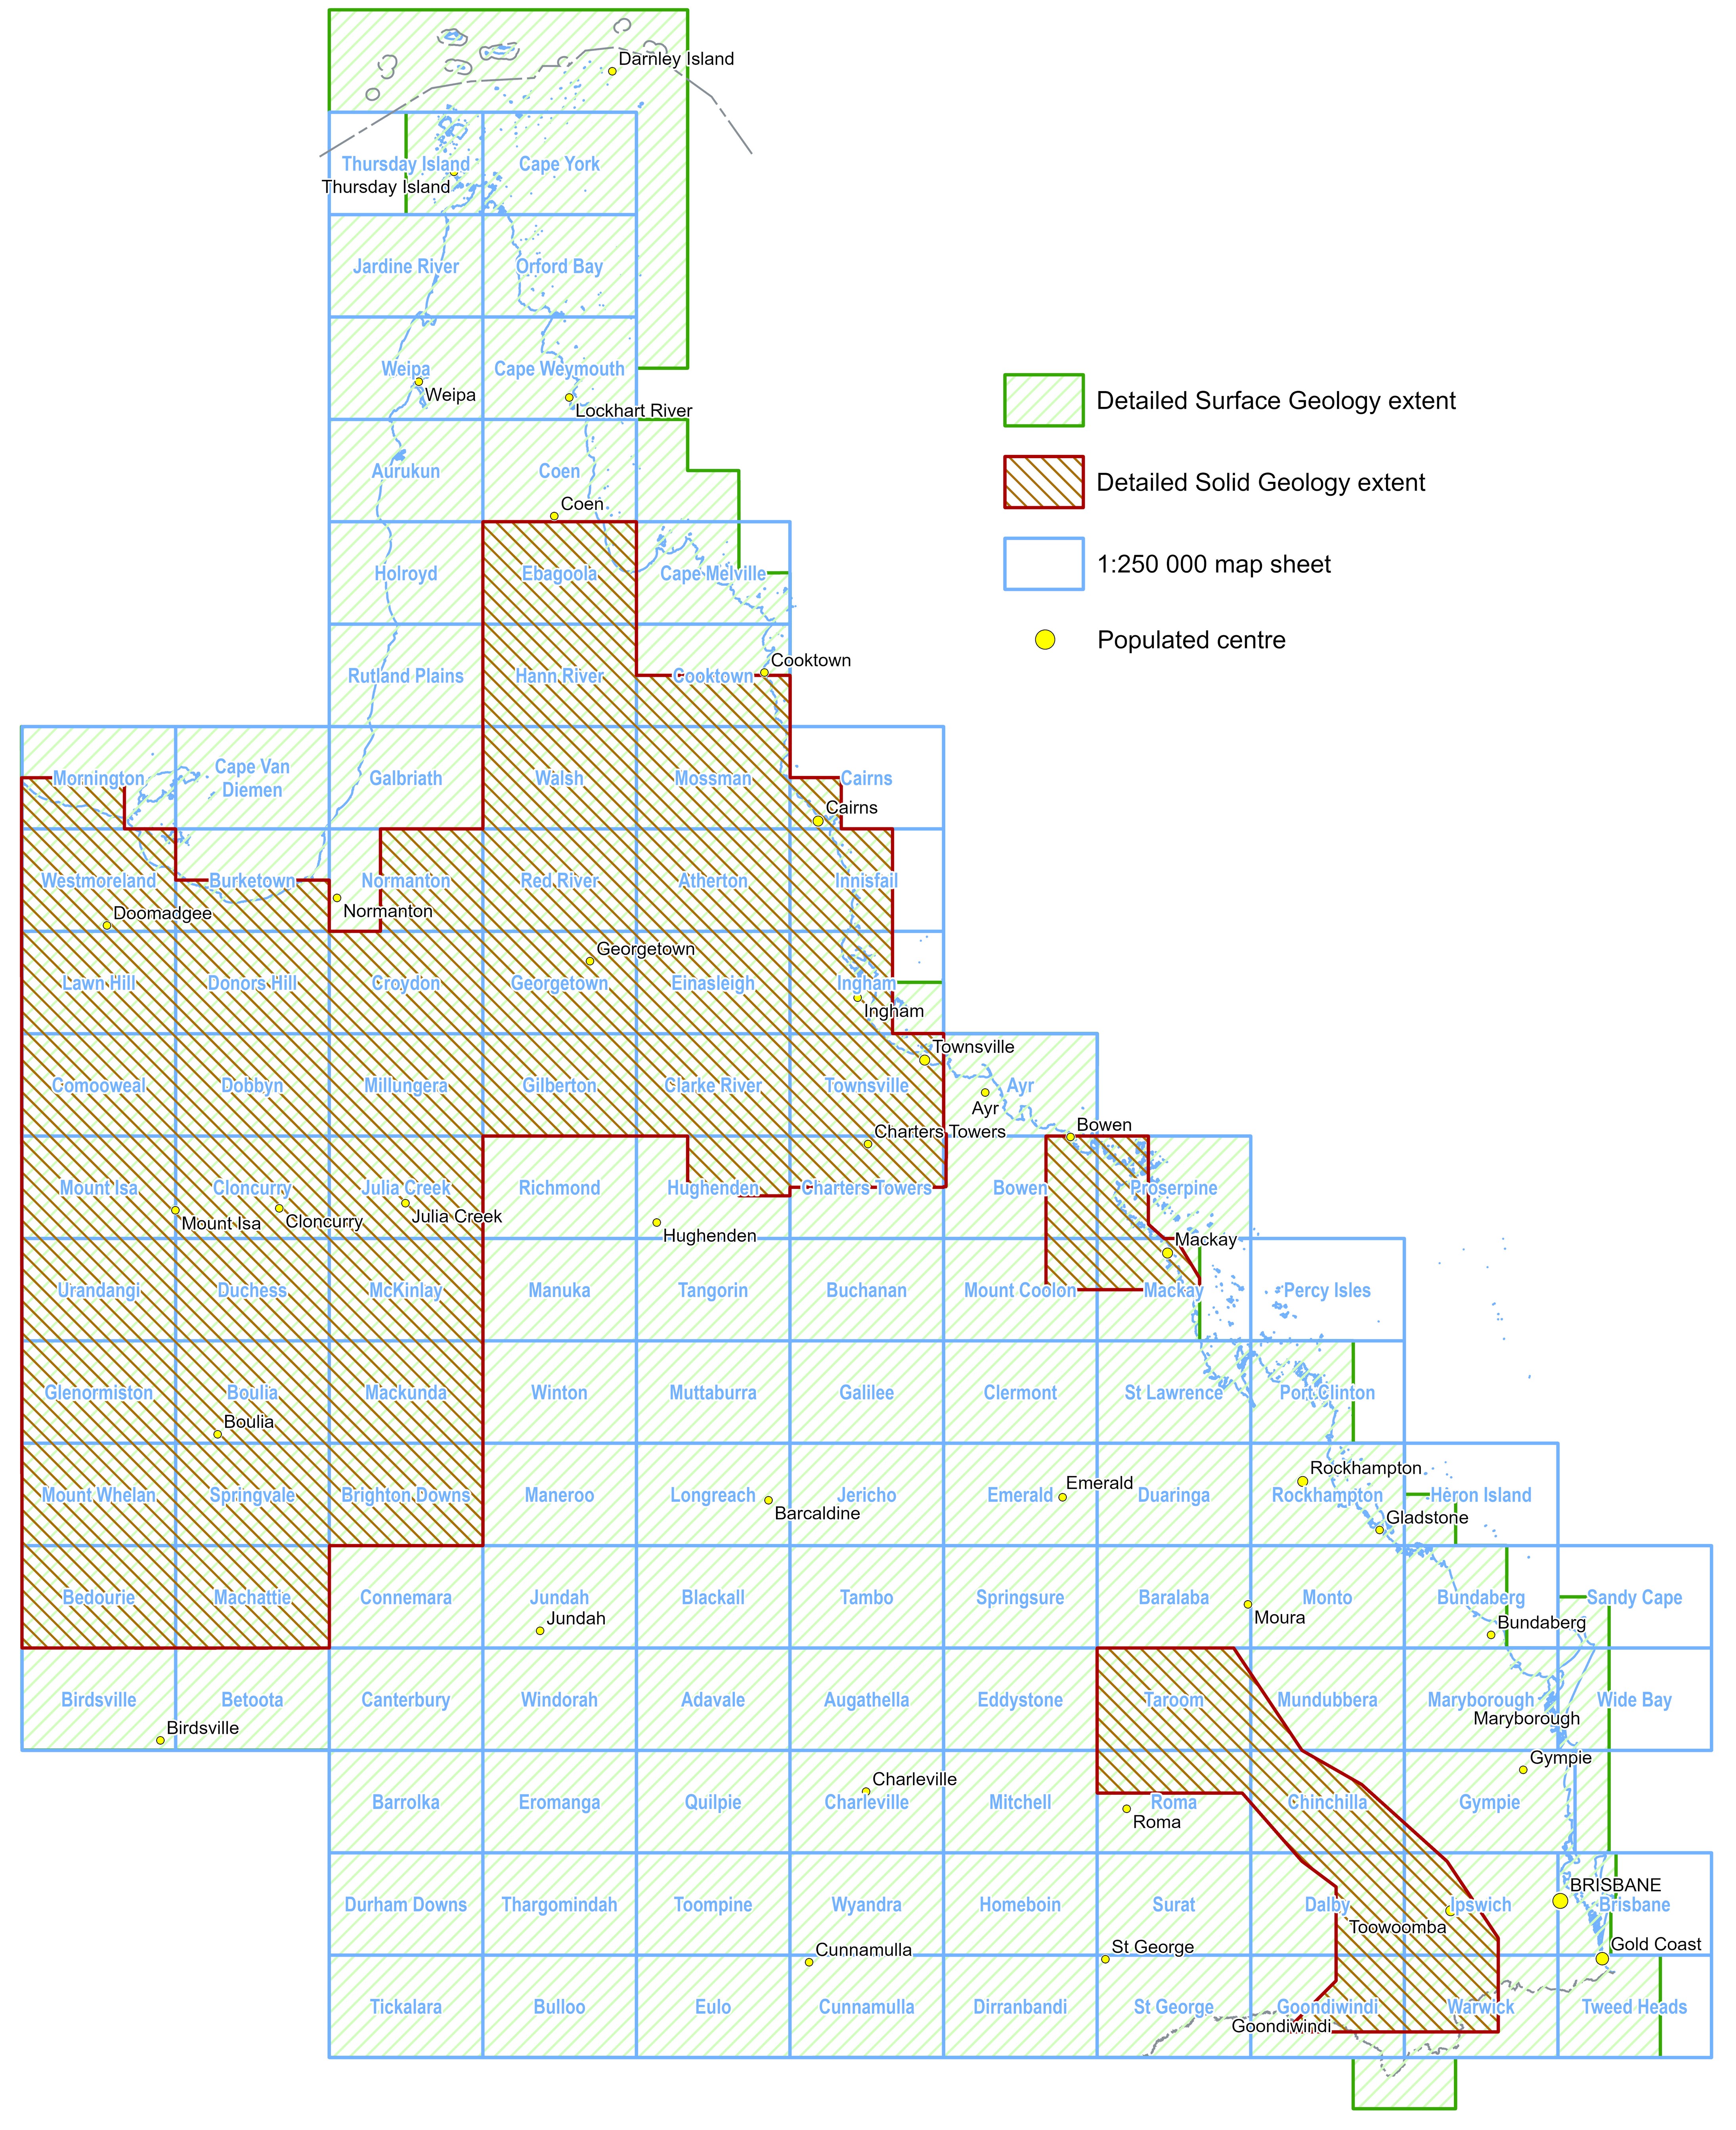
Overview
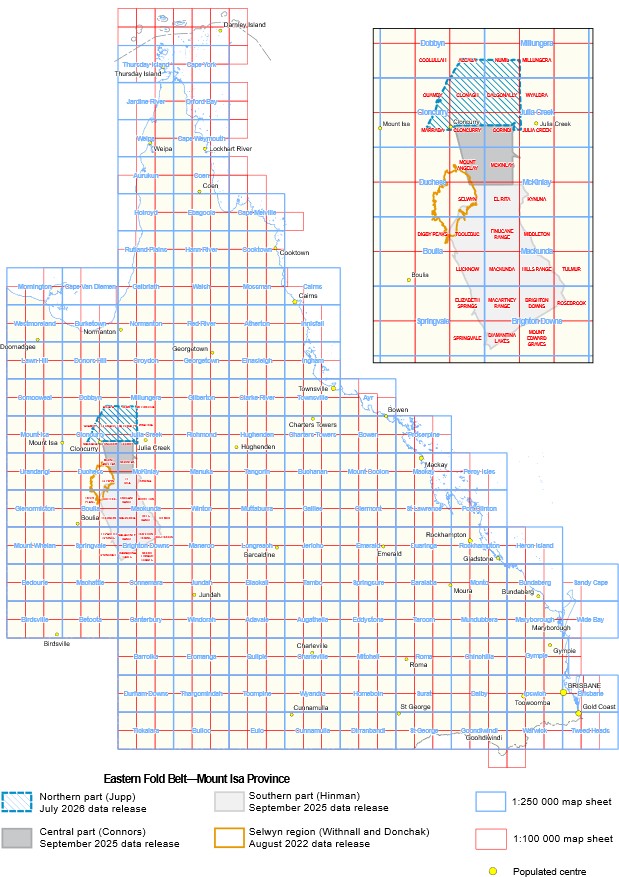
Northern Eastern Fold Belt revision—Mount Isa Province
An updated solid geology interpretation has been produced for the undercover areas in the northern part of the Eastern Fold Belt covering Cloncurry, Queensland and areas to the north and east. This solid geology interpretation is an extension of a series of interpretations of solid geology in the eastern succession initially carried out by consultants at the WH Bryan Mining and Geology Research Centre of the Sustainable Mineral Institute, University of Queensland (Hinman et al., 2018; Murphy et al., 2017; Connors, 2019). This current interpretation was carried out by SRK Consulting (Australasia) Pty Ltd (JUPP, 2024). The catalyst for this program was the Cloncurry North magnetic and radiometric survey flown at 100m line interval, which allowed for a significant upgrade to the solid geology (GSQ, 2018).
All available geological and geophysical datasets were compiled and integrated into ArcGIS Pro as the main interpretation environment, enabling consistent spatial referencing and rapid cross-comparison between layers. Seismic datasets were additionally loaded into GOCAD software to support 3D visualisation and interpretation, particularly for assessing subsurface structure and cover–basement relationships that are difficult to infer from potential-field data alone.
The primary magnetic and radiometric datasets used for the interpretations include the Mount Isa Region Airborne Data Merge 2022 (Greenwood, 2022), which includes the Cloncurry North survey. This dataset covers the western third of the Project area with line spacing of 100 m or better. Derivative products included:
- Total Magnetic Intensity (TMI)
- TMI-Reduced-to-Pole (RTP)
- First vertical derivative TMI (TMI-1VD)
- First vertical derivative RTP (RTP-1VD)
- Potassium (%) radiometric grid
- Thorium (ppm) radiometric grid
- Uranium (ppm) radiometric grid
- Dose Rate (mG/h) radiometric grid
Additional processed magnetic and radiometric datasets, and associated products downloaded from the GSQ Open Data Portal (https://geoscience.data.qld.gov.au/) to assist with interpretations in the broader Project area included:
- Queensland Statewide Magnetic Data Merge, (GSQ, 2018a)
- North West Queensland SEEBASE study and GIS (Frogtech Geoscience, 2018)
- North West Queensland SEEBASE study and GIS (Frogtech Geoscience, 2018)
Gridded data were downloaded from Queensland Statewide Gravity Data Merge (GSQ, 2018b) with additional processed data sourced from the Northwest Queensland SEEBASE study and geographic information system (GIS) (Frogtech Geoscience, 2018). Several derivative products were available and included:
- Bouguer anomaly (Figure 3.3)
- 1VD and 2VD
- High pass filters (10–40 km, 40–100 km)
- Tilt Derivative
- Isostatic Residual
Seismic data (SEG-Y) downloaded from the Geoscience Australia Data and Publications site included:
- L180 Processed Seismic Package (Maher, 2008)
- L184 Processed Seismic Package (Maher, 2009)
- L204 Processed Seismic Package (Costelloe, 2015)
Relevant seismic lines included:
- 06GA-M4
- 07GA-IG1
- 14GA-CF1
Geology data was incorporated from the GSQ solid geology seamless map and at the time of the interpretation the Connors Central Eastern Fold Belt (CEFB) report was not integrated, so that data was used to edge map the two products.
- Detailed Solid Geology – Queensland (GSQ, 2023a)
- Central Eastern Fold Belt Solid Geology (Connors, 2019)
- Queensland Detailed Surface Geology (GSQ, 2023b)
- Queensland Detailed Structure (GSQ, 2023c)
Airborne electromagnetics were also used to constrain the interpretation; the data was sourced from the GSQ Open Data Portal (https://geoscience.data.qld.gov.au/) and included:
- East Isa Airborne Electromagnetic Survey, QLD (McInnes, 2016)
Registered 2D Magnetotelluric inversion depth slices were integrated into ArcGIS to assist with interpretation (Seillé et al., 2022).
Borehole location data were provided by GSQ. No budget allowance was made within the Project for company data review. However, a high-level review of historical company reports was conducted for drill hole lithology data and interpretations where available.
A solid geology interpretation was conducted across the area of interest (AOI) using a range of available datasets. The key focus of the Project was to develop updated interpretations of the undercover area based on the updated 100 m spaced datasets. The interpretation process involved initial integration of all available geological and geophysical datasets into ArcGIS Pro . Seismic data was additionally integrated into GOCAD for 3D visualisation and interpretation and to assist structural and solid geology interpretations at surface. Each of the key outcropping units within the domains were compared against the geophysical datasets to allow for calibration of each unit. Review of the available solid geology interpretations was also conducted to assist with geophysical calibration and interpretation.
This was also cross referenced against available literature and lithology descriptions. From this review, lithologies were often found to show complex magnetic characteristics based on variable composition across the lithologies. The Mount Fort Constantine Volcanics and Corella Formation in particular were observed to vary widely from low magnetic to high magnetic responses in some areas. Granites additionally were quite variable, with the gravity data, while coarse (i.e. of lower resolution), providing additional control. A high-level review of company drilling data was conducted to extract lithological information where available. This provided some additional compositional constraint.
Based on the geophysical data from surficial datasets, magnetic trends and structures were interpreted applying various magnetic filters and combinations such as magnetic RTP, 1VD, analytical signal, as well as gravity bouguer, gravity high pass filters and gravity 1VD. Following structural interpretations, the intrusive framework was developed, ensuring consistency with the structural linework. Lithologies were then interpreted using the intrusive and structural framework to trace coherent packages of interpreted lithologies.
Interpretations were very much an iterative process with several uncertainties apparent. To highlight these uncertainties (or interpretation confidence), the high-level interpretation confidence model was created based on each of the datasets used and a ranking of uncertainty of each dataset. Distance buffers were applied to outcrop, drilling and seismic datasets illustrating increasing uncertainty from each dataset. Magnetics was ranked by data resolution, and gravity was given a uniform rank across the AOI. A final map was generated as a sum of each of the ranked uncertainties. As expected, areas with a higher level of confidence reflect areas with greater outcrop most notable in the southwest of the map. Uncertainty subsequently increases toward the east as data become coarser and sparser (JUPP, 2024).
Interpretation was carried out by Ben Jupp and reviewed by Chris Woodfull (SRK) and Dominic Brown and Ian Withnall (GSQ). Rigorous pre-processing was undertaken by Departmental Spatial Information staff to align the supplied data with the required schema for the Queensland Detailed Surface and Solid geology datasets; Geological boundaries were created from solid geology polygons and all segments that corresponded to faults attributed as such. All duplicated segments from the fault layer were deleted. Folds and other linear features such as dykes and trends were also re-attributed. All arcs were checked against topology rules used by SI and after necessary corrections were completed, polygons were rebuilt and tagged with keys from the GSQ Rock Units database. Solid geology was then combined with surface geology and all resultant polygons tagged with both surface and solid rock unit keys. Further topology checking and elimination of sliver polygons was carried out. Where required detailed structure arcs were edge-matched with adjoining areas.
Final checking including edge-matching and stitching into the Statewide Detailed Surface and Solid Geology Data was carried out by Departmental Spatial Information staff. The majority of the interpretation has been incorporated into the Queensland solid geology, a brief report on the methodology and implications is attached to the original interpretation.
References
CONNORS, K., 2019: Central Eastern Fold Belt, North West Queensland: Solid Geology Interpretation and Insights from Crustal Architecture. The University of Queensland, 57. https://geoscience.data.qld.gov.au/dataset/cr123565
COSTELLOE, R.D., 2015: L204 South Eastern Mt Isa Deep Crustal Seismic Reflection Survey, QLD 2014. Geoscience Australia. http://dx.doi.org/10.4225/25/565BBA1C07514.
FROGTECH GEOSCIENCE, 2018: North West Queensland SEEBASE® Study and GIS. Queensland Geological Record 2018/03. https://geoscience.data.qld.gov.au/data/report/cr106204
GEOLOGICAL SURVEY OF QUEENSLAND, 2018a: Queensland statewide Magnetic Data Merge. Geological Survey of Queensland.https://geoscience.data.qld.gov.au/data/dataset/ds000018
GEOLOGICAL SURVEY OF QUEENSLAND, 2018b: Queensland statewide Gravity Data Merge. Geological Survey of Queensland. https://geoscience.data.qld.gov.au/data/dataset/ds000017
GEOLOGICAL SURVEY OF QUEENSLAND, 2023a: Detailed Solid Geology Queensland [Data set].
GEOLOGICAL SURVEY OF QUEENSLAND, 2023b: Detailed Surface Geology Queensland [Data set].
GEOLOGICAL SURVEY OF QUEENSLAND, 2023c: Detailed Surface Geology Queensland [Data set].
GREENWOOD, M., 2022: Mount Isa Region Airborne Data Merge 2022. GSQ Technical Notes 2022/02.
HINMAN, M., HUISMAN, D., LITTLE, G. & PORTER, M., 2018: Solid Geology Interpretation of the Southern Eastern Fold Belt, Mt Isa, Northwest Queensland. SMI BRC WH Bryan Mining & Geology Research Centre, University of Queensland. https://geoscience.data.qld.gov.au/data/report/cr108143
JUPP, B., 2024: Northeast Mount Isa Solid Geology. SRK Consulting (Australasia) Pty Ltd, Queensland Department of Resources. https://geoscience.data.qld.gov.au/data/report/cr155008
MAHER, J.L., 2008: L180 Mt Isa Deep Crustal Seismic Survey, QLD, 2006. Stacked and migrated data and images for lines 06GA-M1 to 06GA-M6. Geoscience Australia. https://pid.geoscience.gov.au/dataset/ga/69674
MAHER, J.L., 2009: L184 Isa-Georgetown Deep Crustal Seismic Survey, QLD, 2007. Stacked and migrated data and images for lines 07GA-IG1 and 07GA-IG2. Geoscience Australia. https://pid.geoscience.gov.au/dataset/ga/69254
MCINNES, D.J., 2016: East Isa Airborne Electromagnetic Survey, QLD. Geoscience Australia. https://geoscience.data.qld.gov.au/data/electromagnetic/em001359
MURPHY, T., HINMAN, M., DONOHUE, J., PIRLO, M., VALENTA, R., JONES, M. & PRATT, A., 2017: Deep Mining Queensland: Prospectivity Analysis in the Southern Cloncurry Belt, Queensland, Australia. GSQ Commissioned Industry Study by SMI BRC WH Bryan Mining & Geology Research Centre, University of Queensland. https://geoscience.data.qld.gov.au/data/report/cr102015
SEILLE, H., VISSER, G., SIMPSON, J., BROWN, D. & GREENWOOD, M., 2022: Depth to basement characterisation in the eastern part of the Mount Isa Province. CSIRO Report EP2022-5168.
Other data updates this release
Stage 2, Georgetown Region Solid Geology revision - J.S. Spence (GSQ) 2024. This is further revision of the Georgetown Region solid geology, centred on the Red River 1:250 000 map sheet area using geophysical imagery as well as field observation and drill hole data.
For details of Georgetown Region Solid Geology revision - Stage 1 by R.J. Bultitude, Minerals Geoscience, Geological Survey of Queensland, Department of Natural Resources and Mines, Manufacturing, and Regional and Rural Development refer to May 2025 data release notes. Updates - GeoResGlobe
Revision of Ayr 1 : 250 000 map sheet area geology to match revised topographic coastline
New geology updates—July 2026
Line ID descriptions for data extents—July 2026
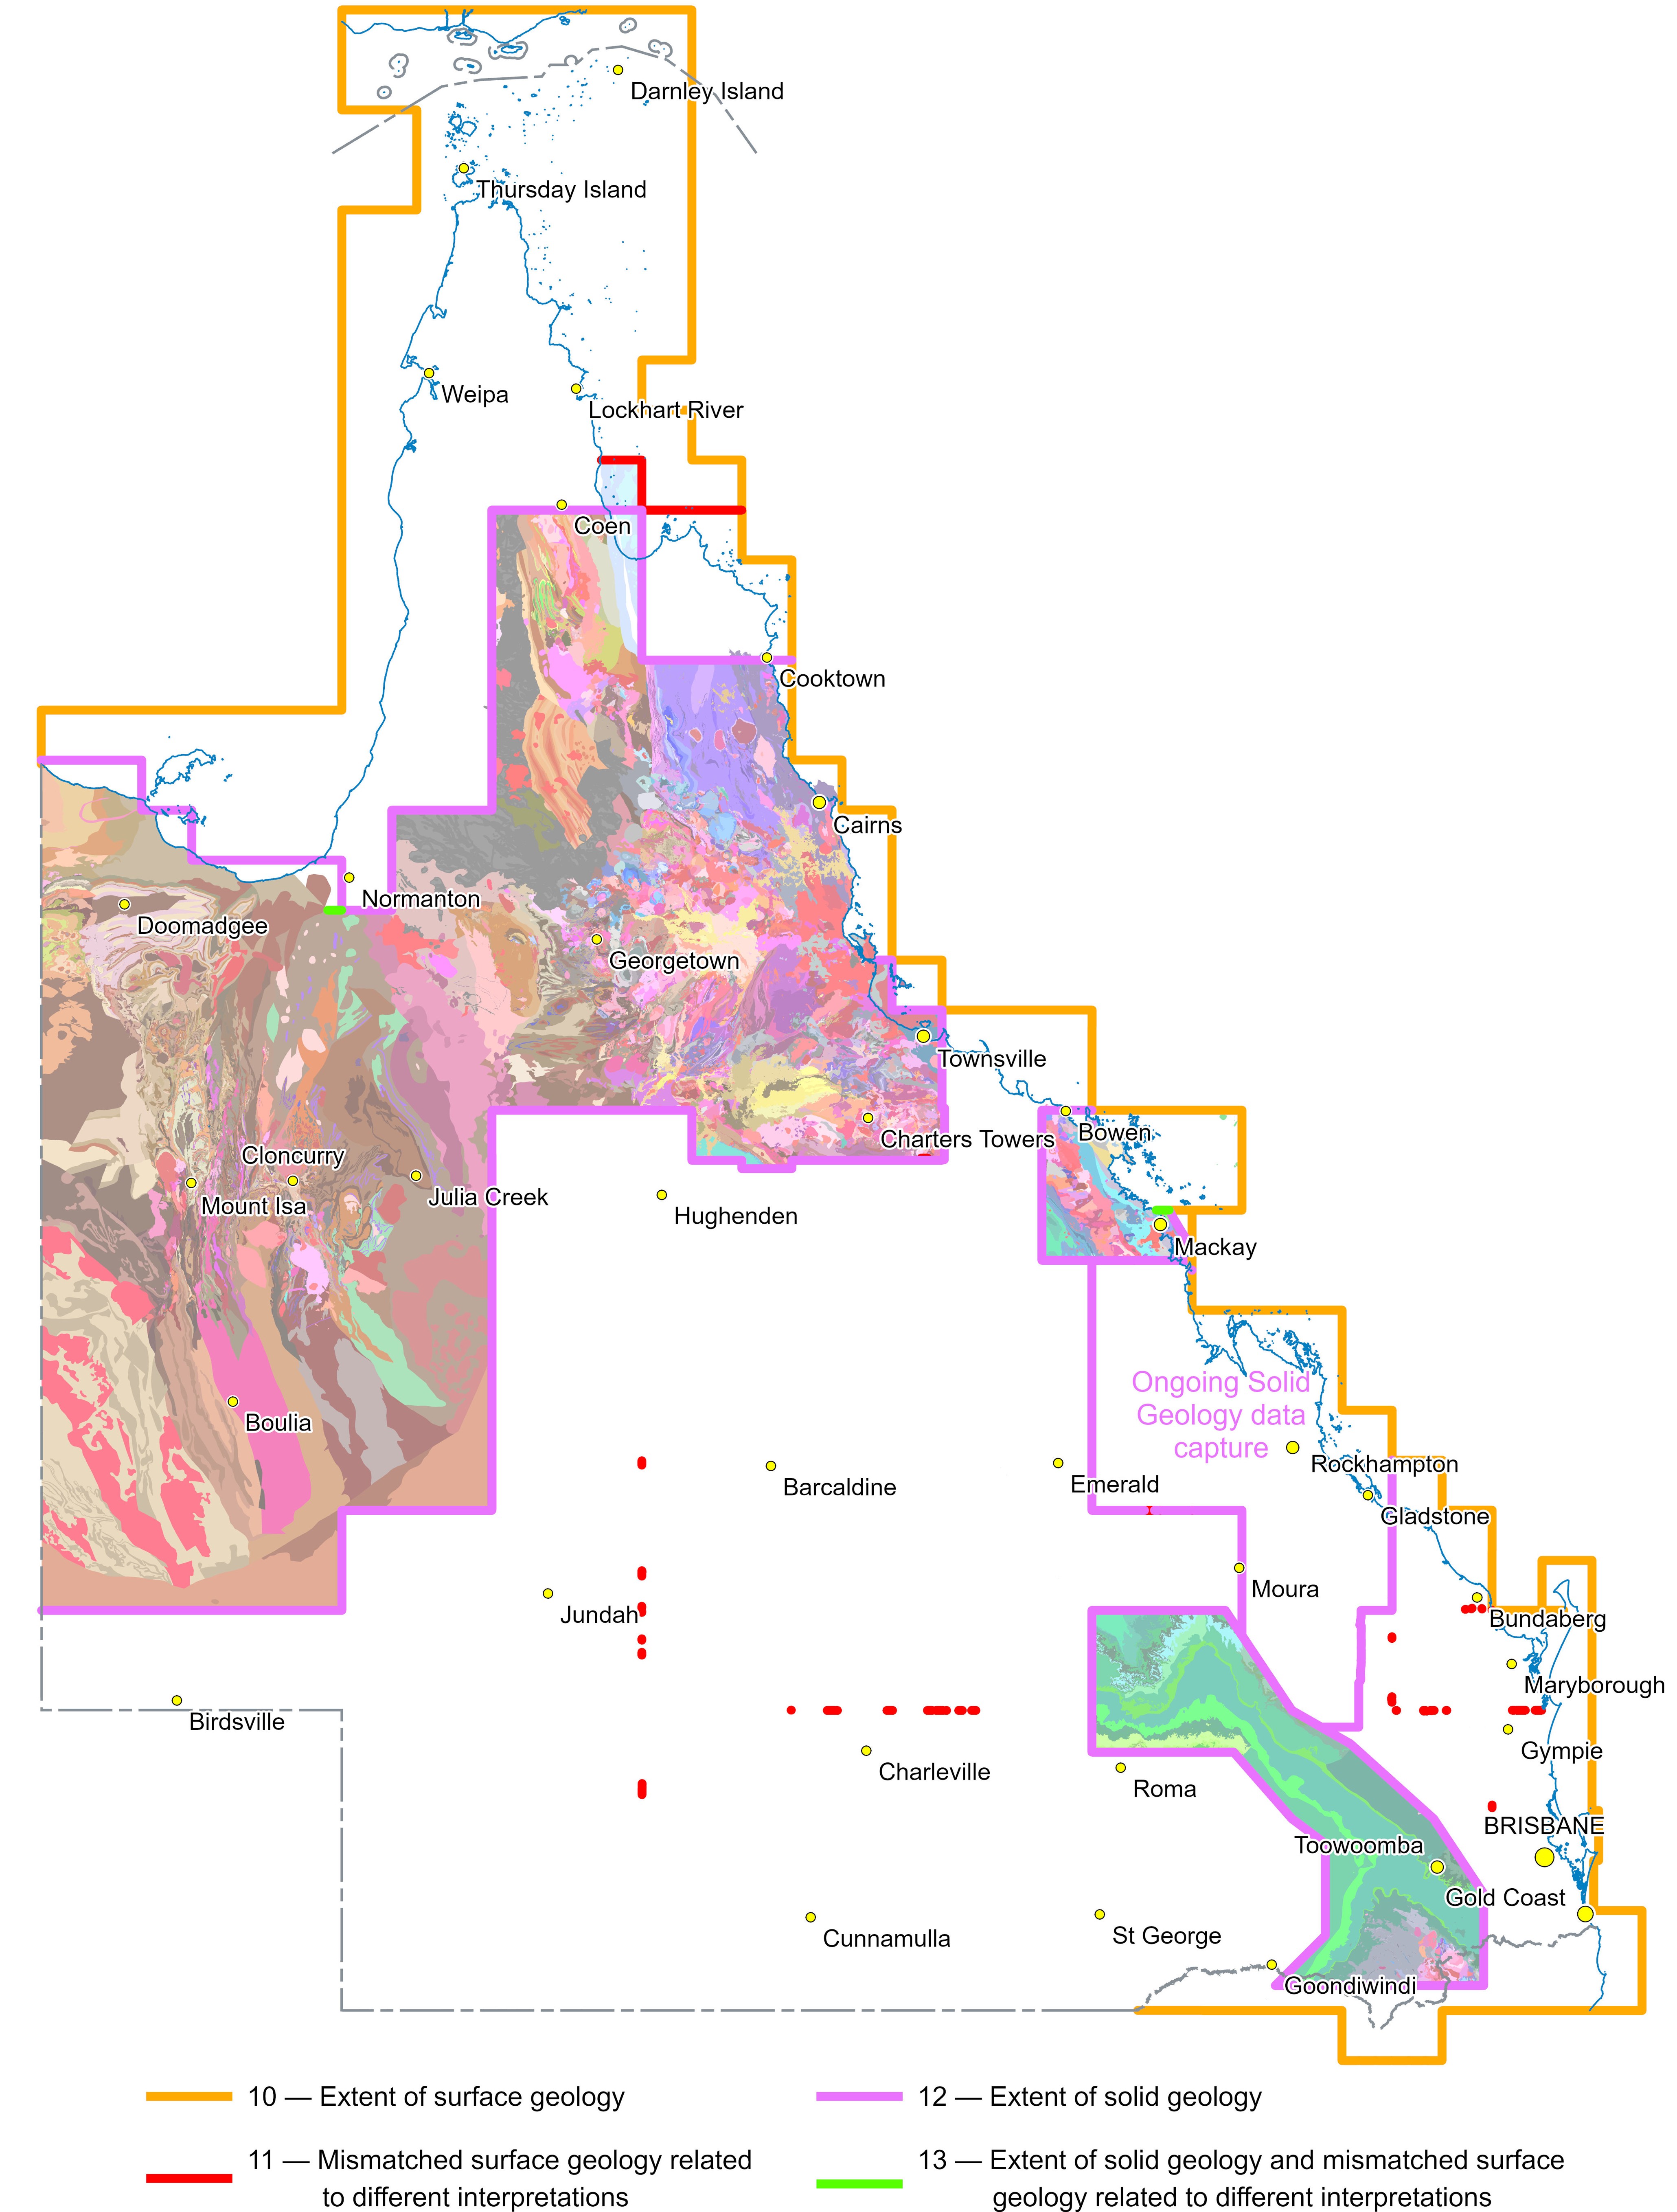
Line ID descriptions for data extents and errors
The seamless departmental detailed geology datasets have been compiled from multiple sources over many years, and inconsistencies may be present in some cases. potentially across multiple map sheets. These issues are being addressed progressively, to improve data quality. Constructive feedback from our data users is welcomed and can be directed to:
Please e-mail your feedback to:Geological Information
Department of Natural Resources and Mines, Manufacturing and Regional and Rural Development
geological_info@nrmmrrd.qld.gov.au
Attn: Geoscience Data Management Team, Spatial Information
Link to detailed geology data index
Queensland detailed geological data index
This index represents data capture scales. Large areas of the State, most particularly in the State’s southwest, were mapped in the 1960’s and 1970’s using 1:85 000 aerial photography. Subsequent mapping progressively used more detailed larger scale photography as it became available. Recent data capture has used the best available satellite imagery and geophysical survey information.
Link to geological compilation map index
Queensland geological compilation map index
Since the September 2023 data release, new or revised compilation maps of various types and scales have been generated over the August 2022 and September 2023 data release areas. For further details please refer to the geological compilation map index and accompanying spreadsheet via the above link. In coming months, maps will be generated over areas covered by the more recent May 2025 and September 2025 data releases.
All areas covered by new or revised data will have new compilation maps generated. These maps will be available from the GSQ Open Data Portal soon. GSQ Open Data Portal | Business Queensland
QSpatial Data Package Contents
The latest detailed geology data can be downloaded from QSpatial Catalogue (qldspatial.information.qld.gov.au). Data is provided in three separate packages for structure, surface and solid geology. Each package contains:
- ESRI file geodatabase, shapefile, and .lyrx file
- MapInfo .tab files (symbolised)
- QGIS .qlr file
- Custom fonts
- Release notes and symbolisation instructions
- Metadata statement
Planned content future data releases
March 2027 data release
- Normanton-W Cape York Solid Geology Interpretation—R.J. Bultitude (GSQ)