Measurements
The GeoResGlobe utilises the Web Mercator map projection. This projection is the most commonly used coordinate system used in web applications to show world extents. Its strength is that it preserves direction and the shape of data, however the downside is it distorts distance and area.
The use of the GeoResGlobe for the purposes of precise measurement is not advised.
For more information, please refer to the Locational accuracy section or the Disclaimer notice on the Welcome page for further details.
Measurement tool
The measurement tool provides a quick way of measuring features on the map. It will display a temporary measurement, visible until the tool is deselected or a new measurement is drawn.
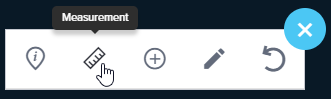
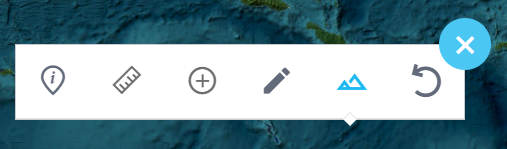
The measurement tool is available via the menu bar. Expand the menu to view the available options.
Click on the Measurement icon to activate the tool.
Measure line
To measure a line using the Measurement tool
- Zoom to a location on the map you wish to measure.
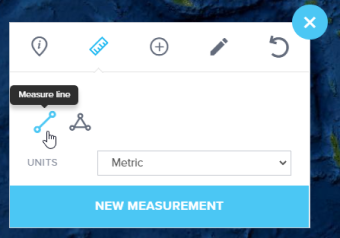
- Expand the toolbar and select the Measurement tool.
- Click on Measure line and adjust the unit of measurement, if required.
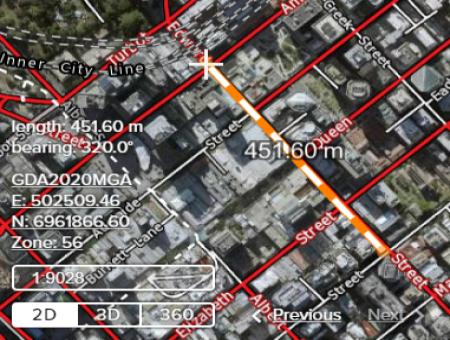
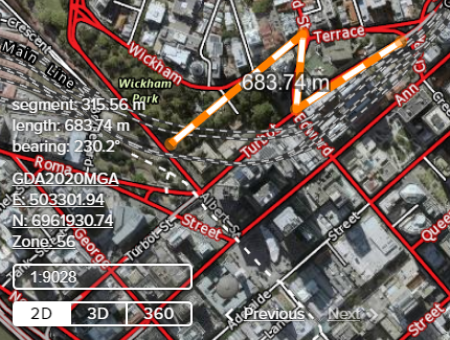
- Click on the map to start drawing a line. The length value will appear over your line, and update dynamically as you draw. The segment length, overall length, and bearing appear in the bottom left corner of the map.
- Click again at each bend in the line to create a vertex.
- Double click to finish the line.
- View the measurement result on the screen.
- To remove the measurement from the map, click New Measurement

If the line needs adjustment, the individual vertices can be picked up and moved. Please note this tool differs from editing a place in that no new vertices can be added, nor can the whole object be picked up and moved. Line measurements with multiple vertices can only be made in 2D view mode.
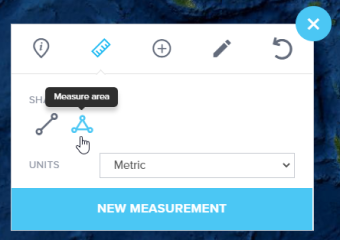
Measure area
To measure an area using the Measurement tool
- Zoom to a location on the map you wish to measure.
- Expand the toolbar and select the Measurement tool.
- Click on Measure area and adjust the unit of measurement, if required.
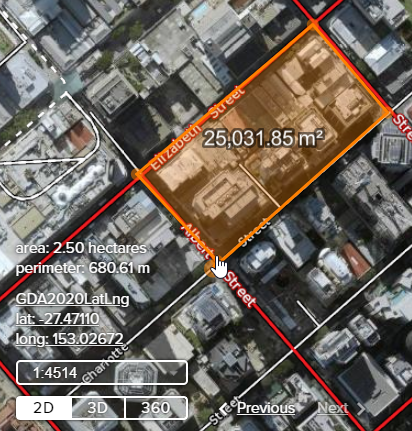
- Click on the map to start drawing an area line. An area value will appear over your polygon, and update dynamically as you draw. Area and perimeter values will also appear in the bottom left corner of the map.
- Click again at each corner of your area to create a vertex.
- Double click to finish the area measurement.
- If the area needs adjustment, the individual vertices can be picked up and moved.
- Note that no new vertices can be added, nor can the whole object be picked up and moved.
- To remove the measurement from the map, click New Measurement.
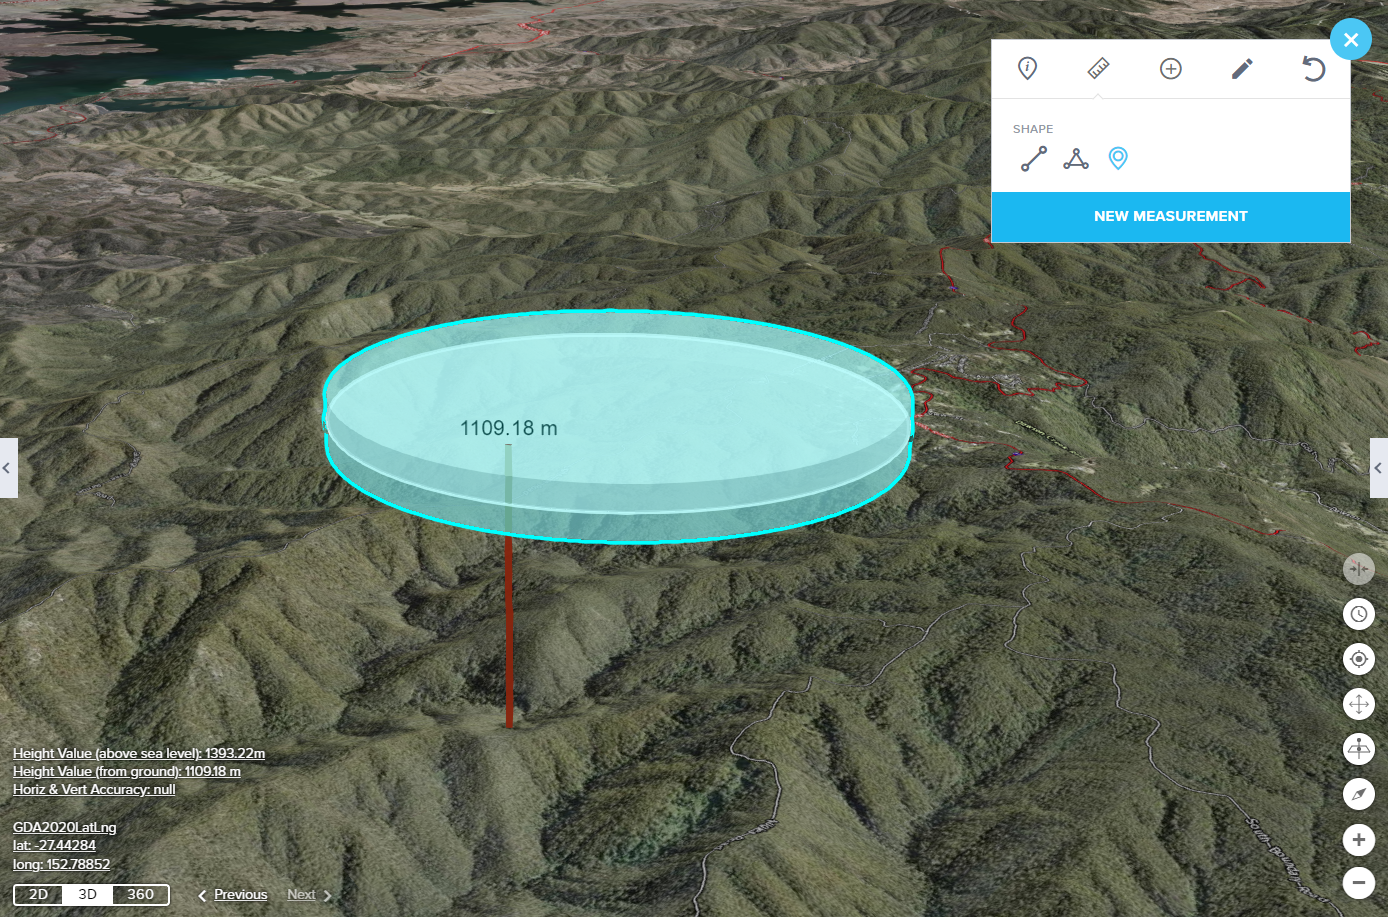
Measure height
To measure the height of a 3D object
- Zoom to a location on the map you wish to measure.
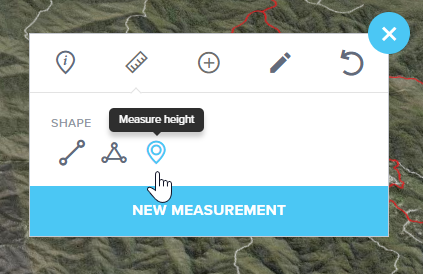
- Ensure the view mode is either 3D or 360 for the option to appear under the Measurement tool.
- Draw a 3D object using the drawing tools or include a scene service via the user-added data tool.
- Expand the toolbar and select the Measurement tool.
- Click on Measure height.
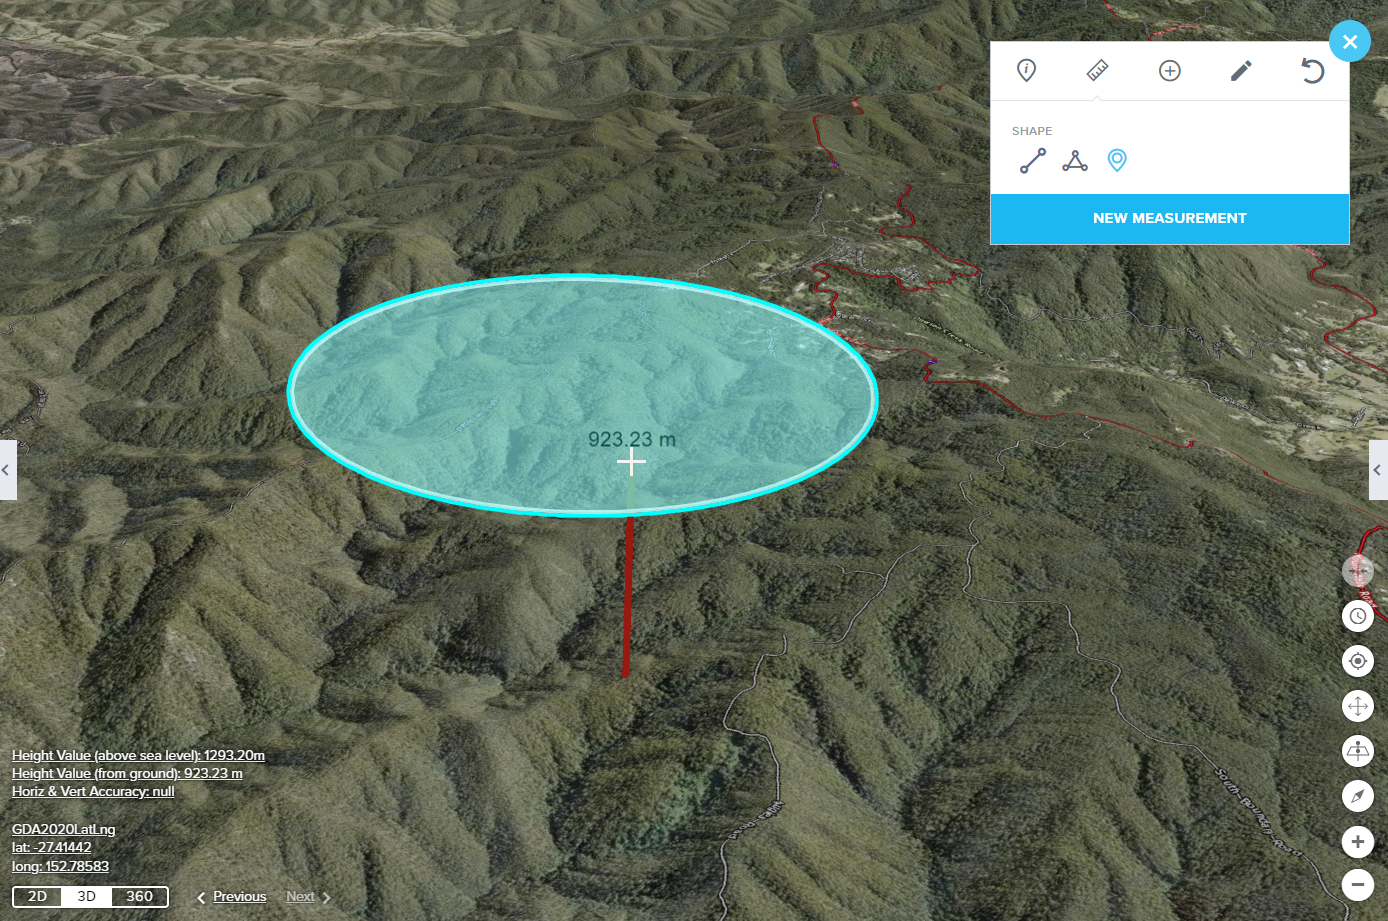
- Then click on at a point on the 3D object you wish to measure the height.
- The height (above sea level) and height (from ground) will be displayed in the bottom left corner of the map.
- The height from the ground to the point on the 3D object is delineated on the map and the height value is also displayed.
- If an extrusion has been applied to a 3D object, then it will take the extrusion into account when calculating the results.
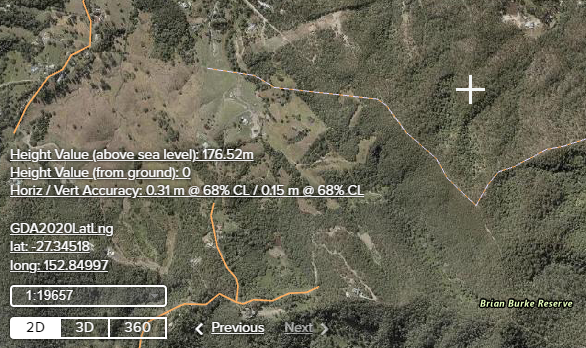
Elevation tool
The Elevation tool can be accessed via the toolbar in the GeoResGlobe application. Please note that this tool is only available when you are viewing the map in 2D mode.
When you activate the Elevation tool and click on a specific location on the map, it will return the elevation of that point. This elevation data is obtained from a Digital Elevation Model (DEM).
In addition to providing the elevation value, this tool may provide an accuracy statement. This statement helps users understand the precision and reliability of the elevation data at that specific location. It's important to pay attention to this statement, as it can indicate how much confidence you can have in the elevation value.
The scale at which you are viewing the map can impact the results returned by this tool. Elevation data can vary in accuracy and detail based on the scale of the map.
The Elevation tool in the GeoResGlobe is a useful feature for accessing elevation information and understanding the accuracy of that data. However, users should be mindful of the viewing scale as it can influence the level of detail and precision in the elevation data returned by the tool.
Measurement options
Distance and area can be measured by using the measurement and drawing tools. The measurement tool provides a quick method for obtaining measurements without the need of drawing a place. Whereas, the drawing tools allow you to retain measurements to save into your map for later use or for printing.
Scale-dependent rendering
Scale-dependent rendering has a significant impact on drawing tools and measurements in web mapping applications. This effect arises from the fact that the level of detail, accuracy, and precision of these tools depends on the scale or zoom level at which the map is being viewed. Here's how it affects drawing tools and measurements:
Drawing tools
- When using drawing tools such as line drawing or polygon creation, the precision of the drawn features can vary with the scale. At larger scales (closer views), you can create more precise and detailed features. This is because the map displays more detail, and you can place points and vertices more accurately. However, as you zoom out to smaller scales, the level of detail decreases, and it can be challenging to create highly detailed features.
- Features drawn with these tools can appear differently at different scales. For example, a curved line drawn at a large scale may appear as a series of straight line segments at a smaller scale, due to generalisation.
Measurements
- The precision of distance and area measurements is directly affected by the scale. At larger scales, you can make more accurate measurements, as the map provides a more detailed representation of the area being measured. As you zoom out, the accuracy of these measurements decreases due to the generalised representation of features. For instance, measuring the length of a road segment may be more accurate at a larger scale compared to measuring the same road at a smaller scale.
- When capturing specific coordinates, the scale-dependent rendering impacts the precision of the captured coordinates. In general, capturing precise coordinates is easier at larger scales where features are represented in greater detail.
Zoom levels
- Web mapping applications often provide predefined zoom levels, and these can affect the precision of drawing tools and measurements. Features created or measured at one zoom level may appear differently or have different measurement results when viewed at a different zoom level.
Labelling and annotations
- The scale-dependent rendering also affects how annotations and labels are added to the map. When using drawing tools to add labels or annotations, you may find that the size and placement of labels are adapted to the scale to ensure readability. Labels can appear differently in terms of size and placement when you change the scale.
Scale-dependent rendering in web mapping applications impacts the precision and accuracy of drawing tools and measurements. Users need to be aware that the level of detail and accuracy of features can vary with the scale at which the map is viewed. It's important to choose the appropriate scale for your specific needs when using drawing tools and making measurements to ensure the most accurate and relevant results. For more information on map scale click here.