Generate an undermining report
The Undermining Report can identify undermining and shaft information within specified distances of a selected land parcel. There are three methods for generating this report, typing a lot on plan, selecting a lot on the map, and running a feature action from the Results window.
Note: Historic records relating to abandoned mines are incomplete and the reliability of this information cannot be guaranteed.
Method 1 – Type a lot and plan number
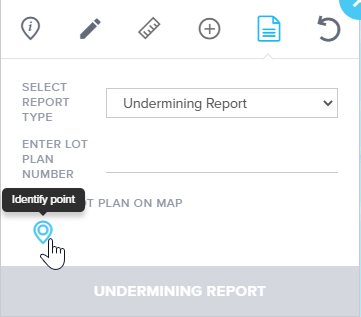
Open the toolbar from the top right of screen

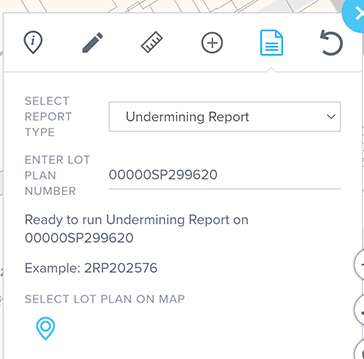
Select Report
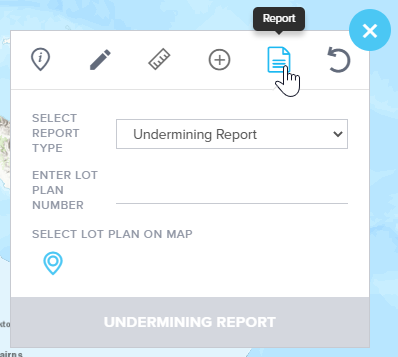
Enter an existing Lot and Plan Number, and press Enter
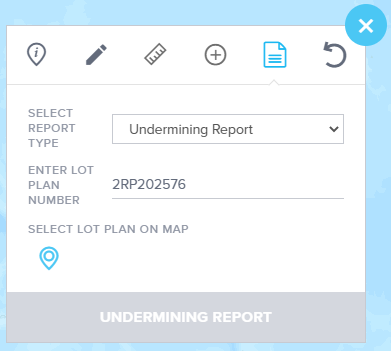
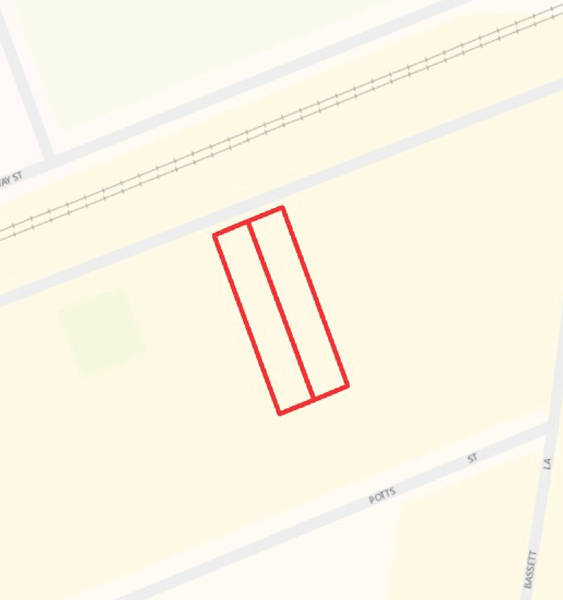
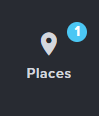
The map will zoom to the selected lot on the map, the Cadastral layer will be turned on, the lot boundary will be highlighted and added to Places, and the Undermining Report button will become active
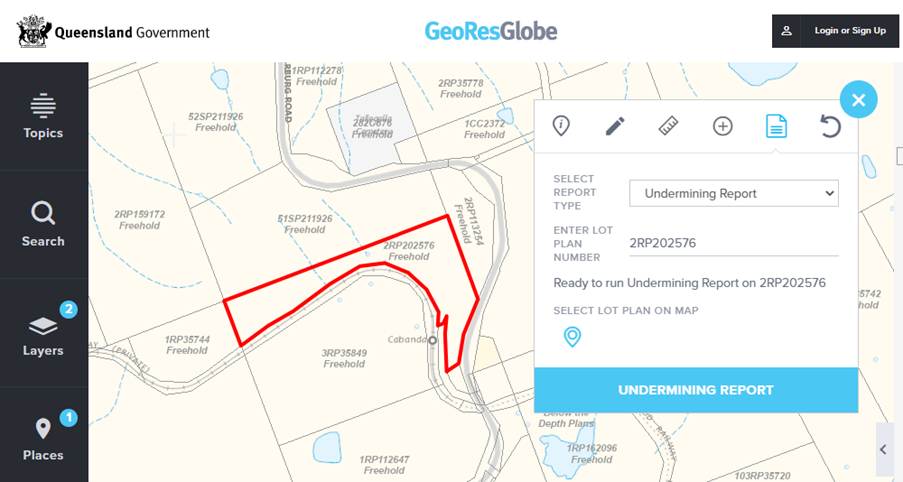
Click on the Undermining Report button

The popup blocker window will not open automatically. A warning about popup blockers will display in the undermining report window after the Undermining report is run.

Each browser has a different way to allow popups. Check individual browser site for details. Example from a Chrome browser shown below:
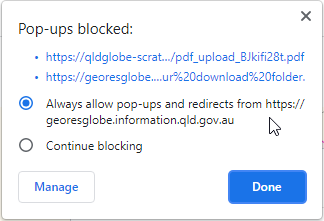
Two PDF documents will be generated, a map and a written report. Depending on your system settings, these may open automatically, or you may need to check your downloads folder.
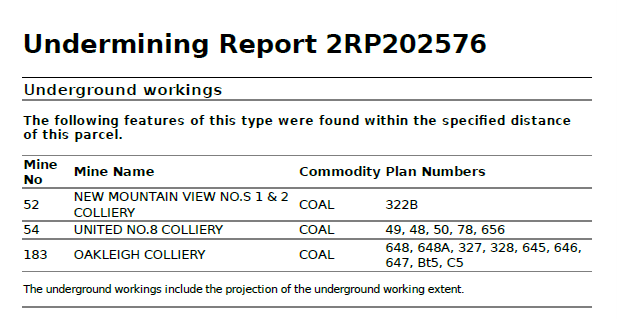
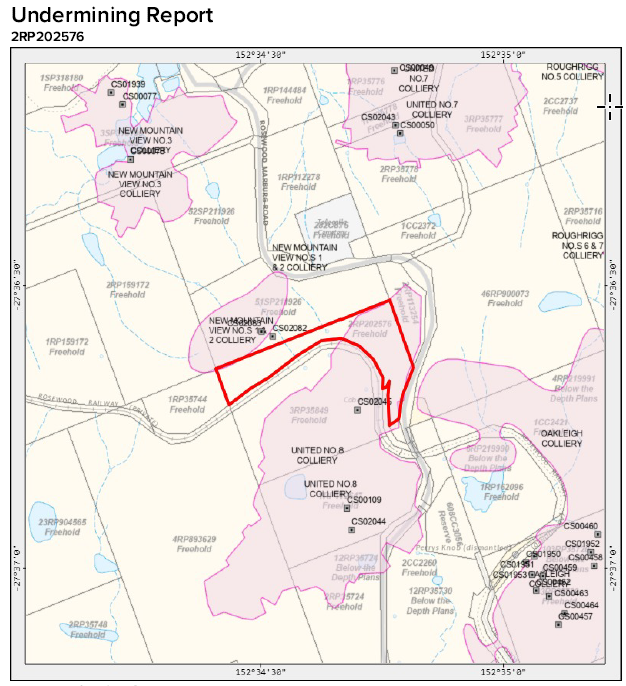
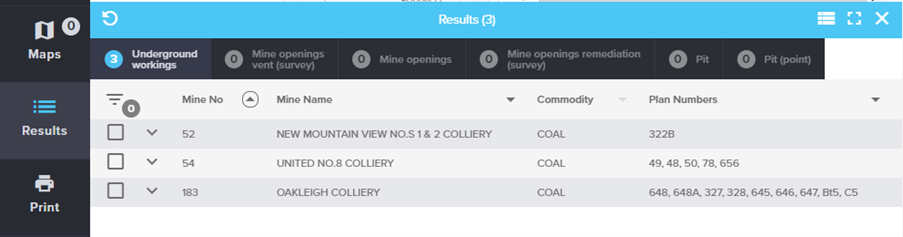
Relevant records are shown in the results tables. In this example, only underground workings have been found. Note the results include a pre-set buffer distance around each feature.
Method 2 – Select a parcel on the map
Open the toolbar from the top right of screen
Select Report
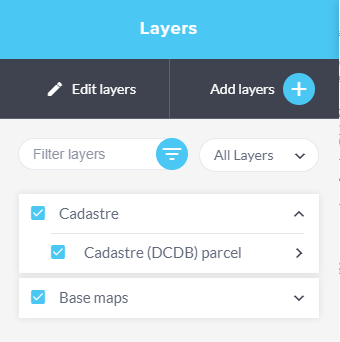
Ensure the Cadastre (DCDB) layer is turned on.
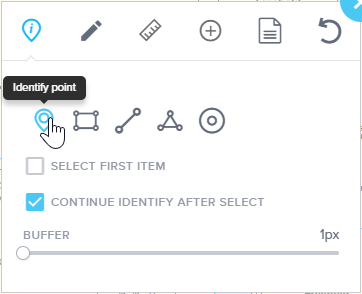
Click on the Identify point icon
Click on a lot on the map
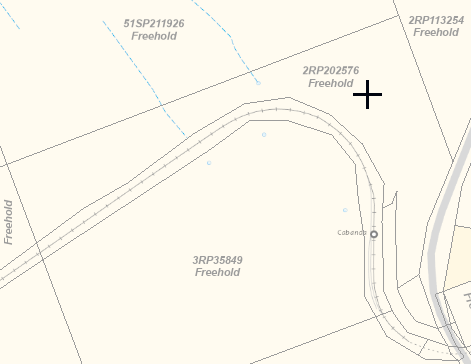
The map will zoom to the selected lot on the map, the Cadastral layer will be turned on, the lot boundary will be highlighted and added to Places, and the Undermining Report button will become active
Click on the Undermining Report button
The popup blocker window will not open automatically. A warning about popup blockers will display in the undermining report window after the Undermining report is run.
Each browser has a different way to allow popups. Check individual browser site for details. Example from a Chrome browser shown below:
Two PDF documents will be generated, a map and a written report. Depending on your system settings, these may open automatically, or you may need to check your downloads folder.
Relevant records are shown in the results tables. In this example, only underground workings have been found. Note the results include a pre-set buffer distance around the lot.
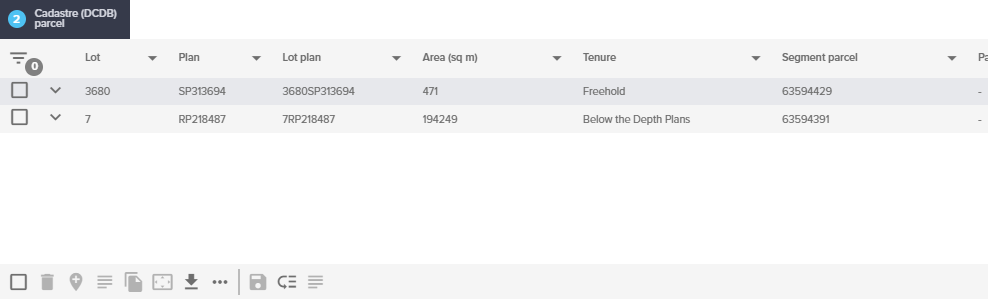
You may find two or more parcels when using “SELECT LOT PLAN ON MAP. The undermining report button will be greyed out if more than two parcels are found.
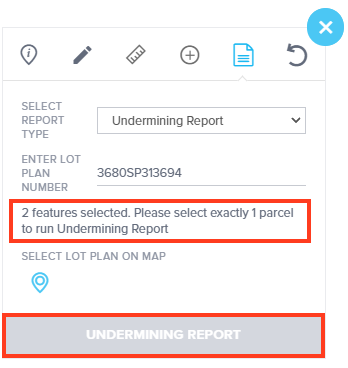
Once you select one parcel in the result window, you will be able to run the undermining report for the selected parcel.
Method 3 – Run a feature action from the results table
Ensure the Cadastre (DCDB) layer is turned on.
Zoom to an area of interest on the map
Open the toolbar from the top right of screen
Select the Identify Point tool
Click on the required parcel
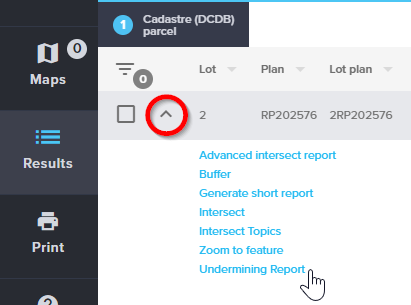
The Results window will display the data for your selected parcel. Click on the chevron next to the record, and then click on ‘Undermining Report’.
The popup blocker window will not open automatically. A warning about popup blockers will display in the undermining report window after the Undermining report is run.
Each browser has a different way to allow popups. Check individual browser site for details. Example from a Chrome browser shown below:
Two PDF documents will be generated, a map and a written report. Depending on your system settings, these may open automatically, or you may need to check your downloads folder.
Relevant records are shown in the results tables. In this example, only underground workings have been found. Note the results include a pre-set buffer distance around each feature.
Turn off an undermining search parcel in Places
During an undermining search, all parcels will be added to Places. If you run a secondary undermining search on a neighbouring parcel, these two parcels will be printed in the map.
You can turn off the first parcel in the Places to remove any unwanted parcels before printing.
Search Distances
When an undermining report is run for a selected parcel, features are returned if they are within a specified distance of that parcel. Search distances are applied as shown in the table below.
| Feature | Buffer distance |
|---|---|
| Mine openings | 20m |
| Mine openings area | 20m |
| Mine openings remediation (survey) | 20m |
| Mine openings vent (survey) | 20m |
| Pit | 20m |
| Pit (point) | 20m |
| Underground workings | 150m |
Undermining search report - BFP Lot Plan
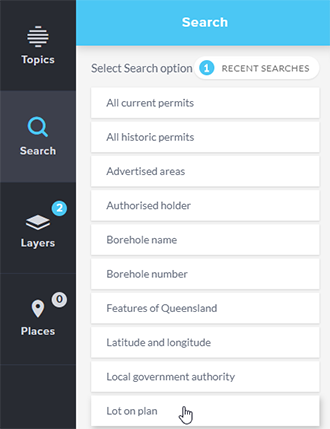
Click Search, Lot on plan and enter the lot number. Press Enter or click the magnifying glass icon to run the search.
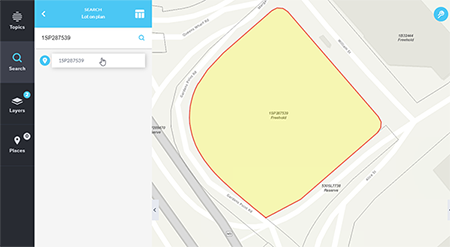
A new Lot/Plan number will be displayed in the search results.
Click on a result to zoom to that feature and highlight it on the map (2805SP299620 in this example).
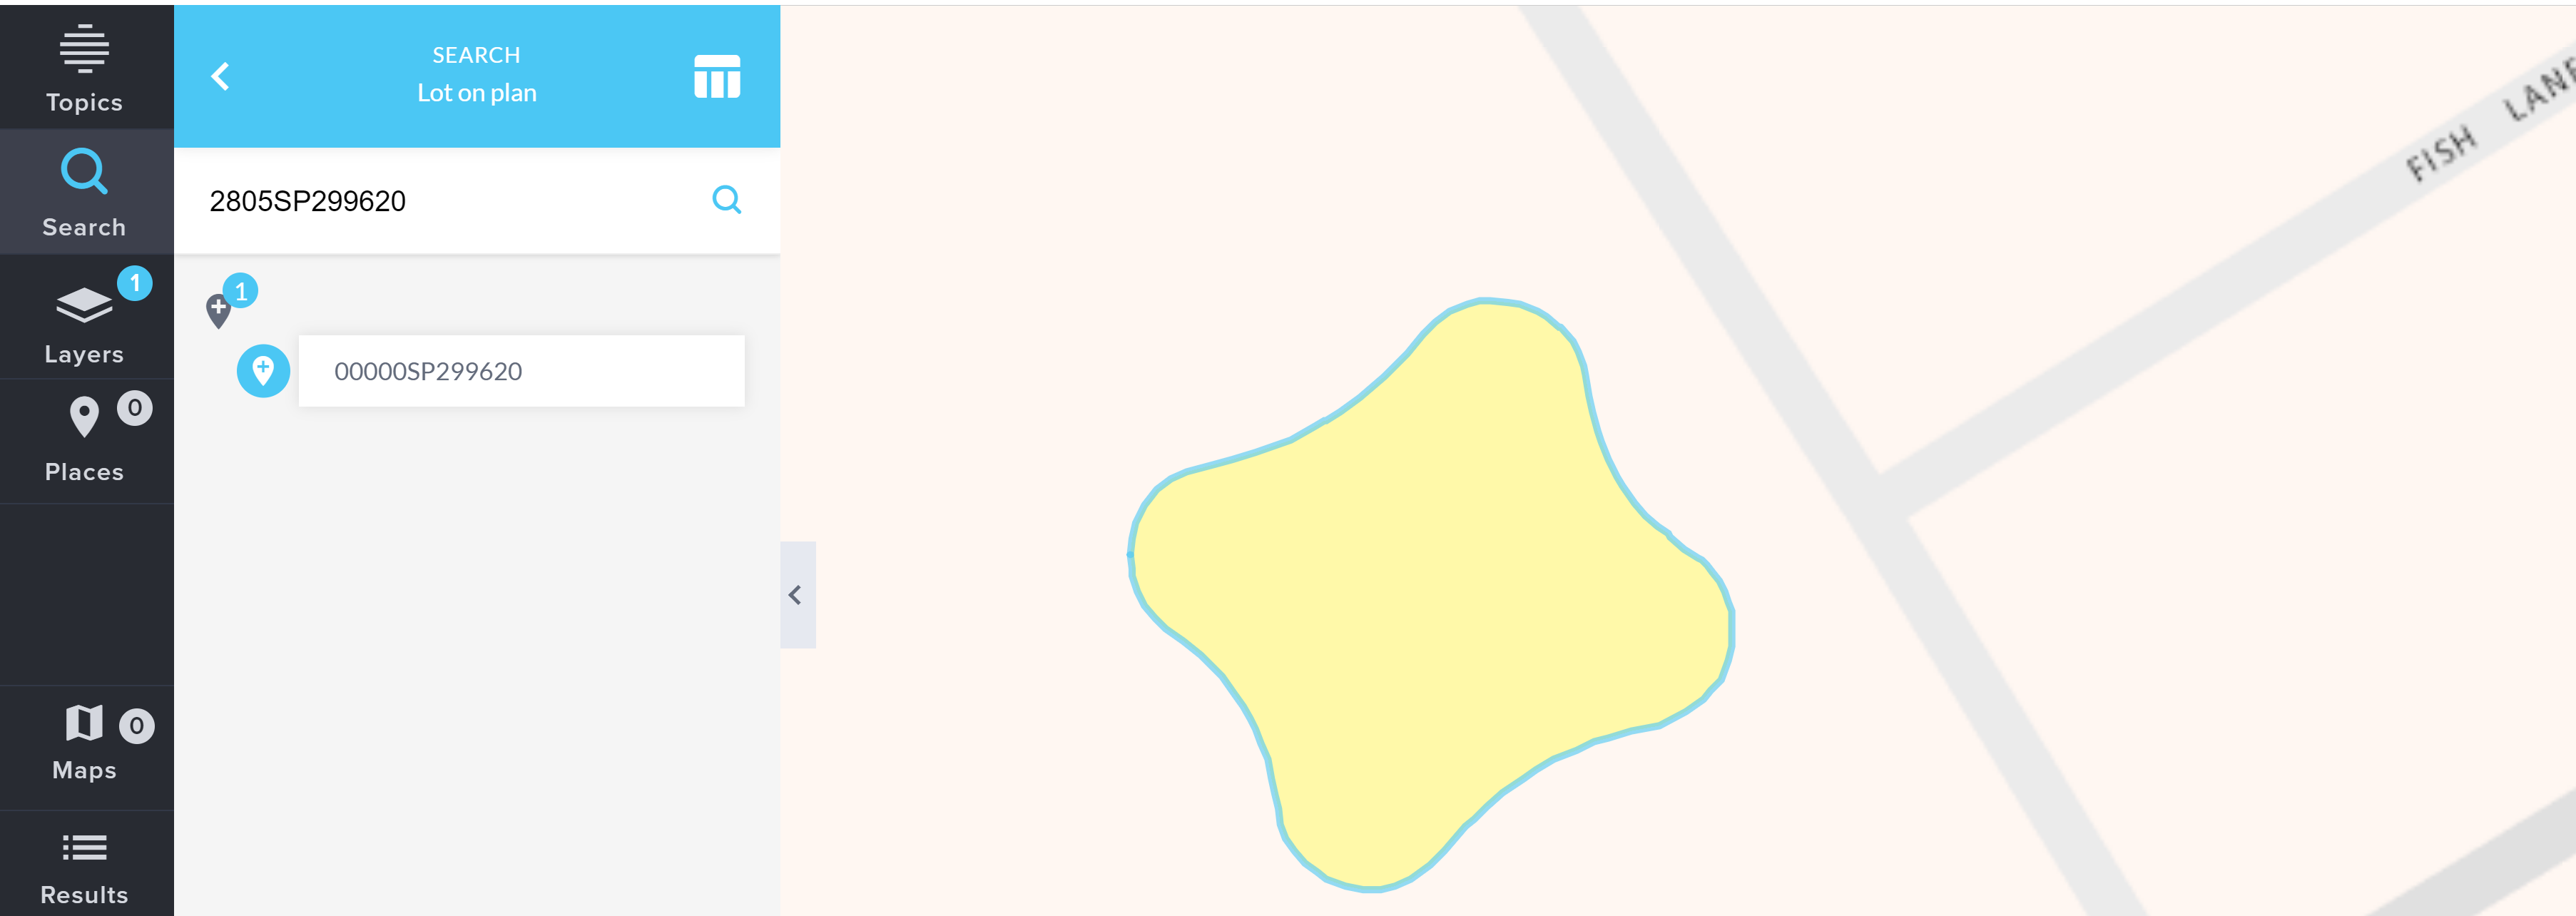
Copy the new Lot/Plan number (00000SP299620 in this example)
Open the toolbar from the top right of screen
Select Report
Paste the new Lot and Plan Number, and press Enter
The map will zoom to the selected lot on the map, the Cadastral layer will be turned on, the lot boundary will be highlighted and added to Places, and the Undermining Report button will become active
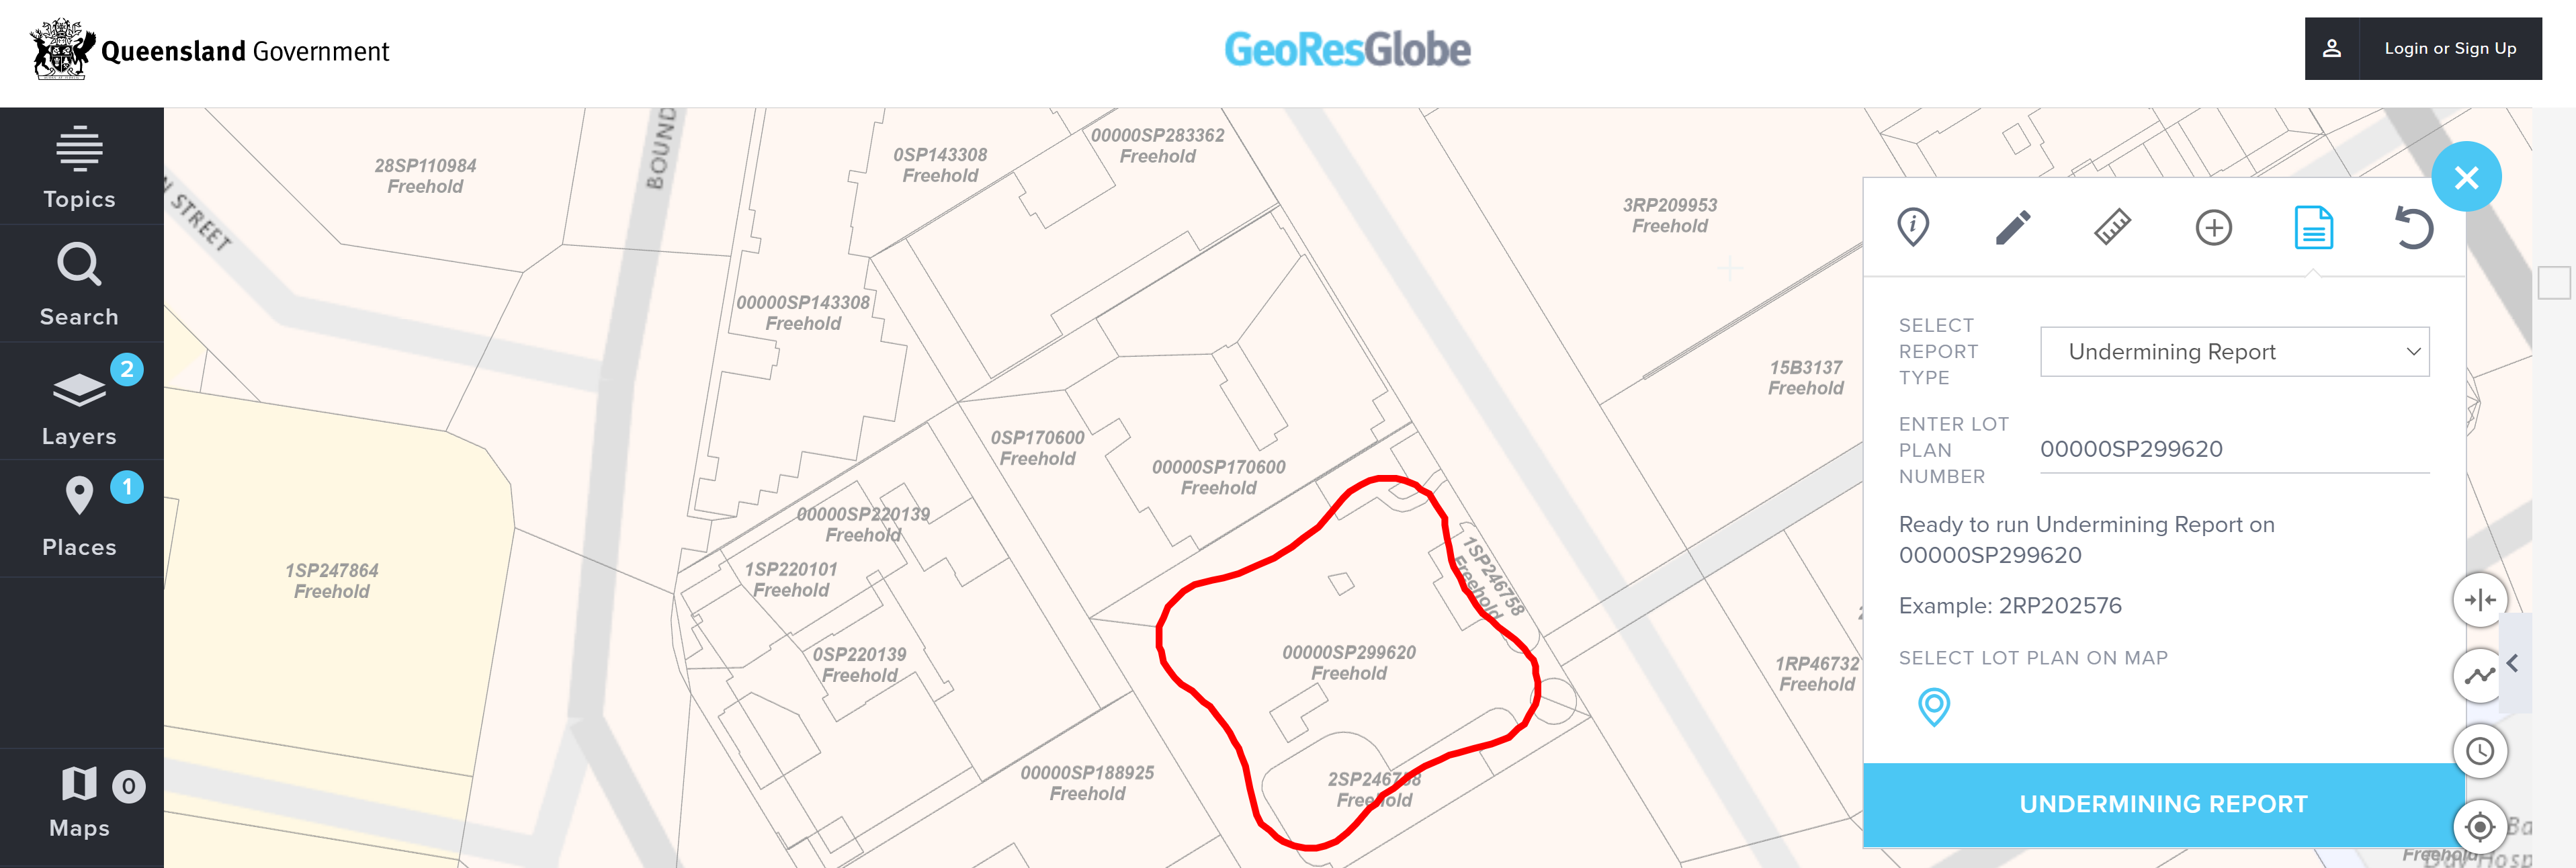
Click on the Undermining Report button to generate the report.
Generate an advanced intersect report
The advanced intersect report can be used to find features which intersect with each other. The user selects a source feature from the results table to run the report on. The csv that is exported lists the percentage that other layers in the map overlap the source feature. Example use cases include finding constraints or native title determinations which overlap a tenure or area of interest.
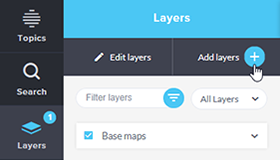
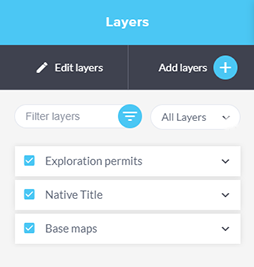
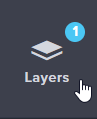
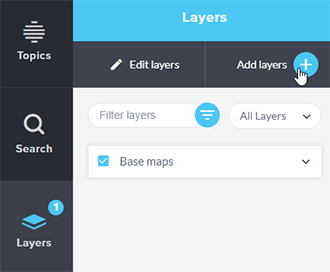
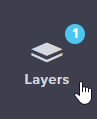
To do this, Click Layers → Add layers
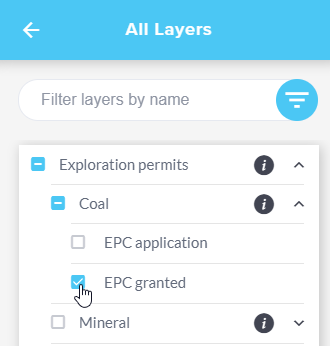
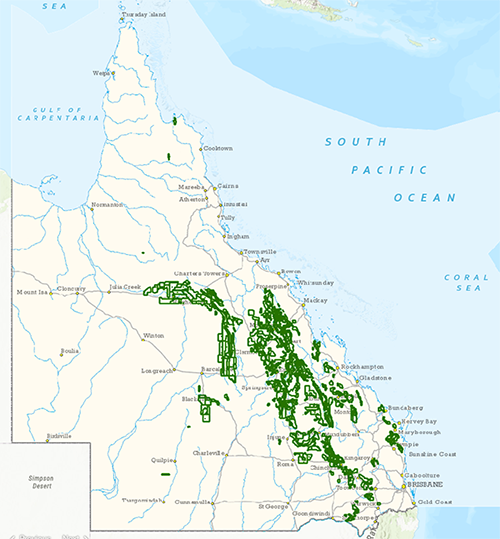
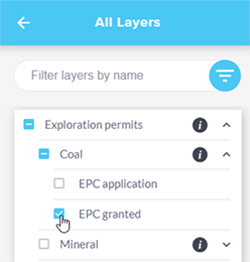
Turn on some layers of interest such as Exploration Permits and Native Title layers.
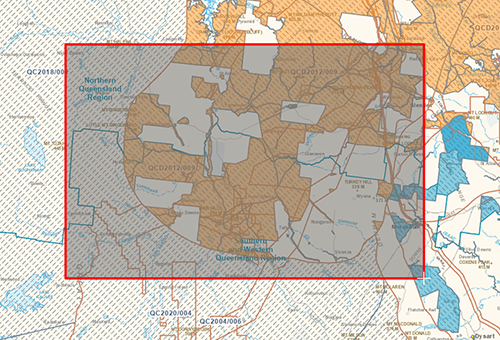
Zoom into an area of interest and use the rectangle identify tool to select some features.
The results table will open.
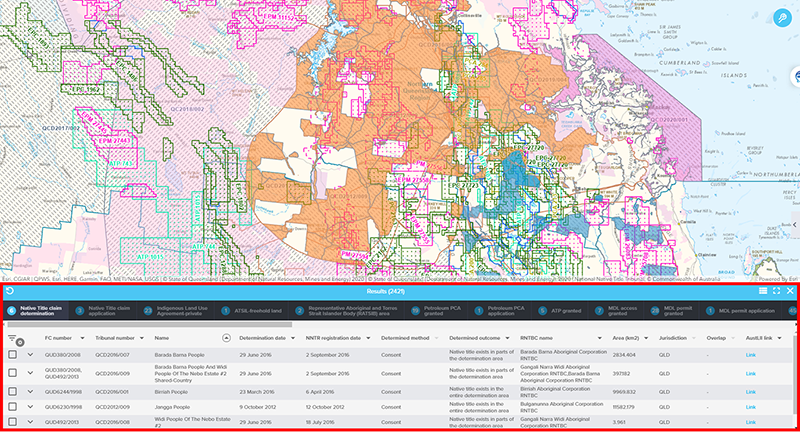
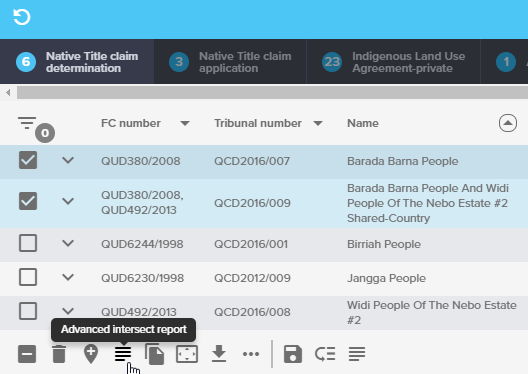
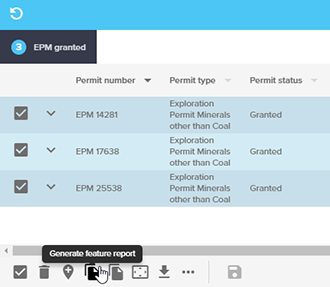
Use the check boxes to select one or more features from the results table as the source features for the intersect operation. (Only select within one tab).
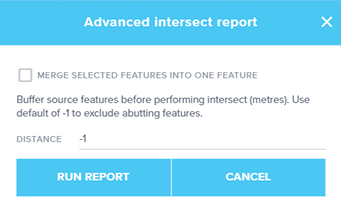
Click on the advanced intersect report button located on the toolbar at bottom of the screen.
Set a buffer value. The default buffer distance is -1, keep this value if you want to exclude abutting features. Set to 0 if you want to include abutting features in the report.
Then click run report.
The results table will update with results from the intersect.
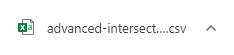
A csv report will download automatically to your computer.
Search for Resource Authorities (LAMP) in an area
You are able to access Resources Authorities (LAMP) from the following layers:
- Exploration permits
- Production permits
- Infrastructure permits
- Information permits
- Cadastre
- Local authorities
Using the Layers tab on the left hand side menu bar, click on Add layers.
Add one or many layers from the above list and/or any of their related layers.
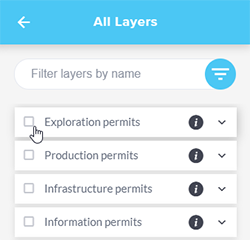
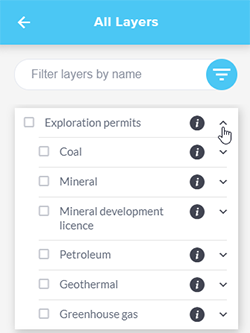
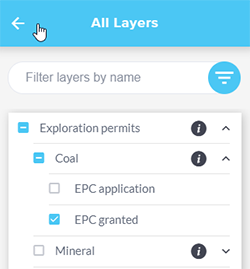
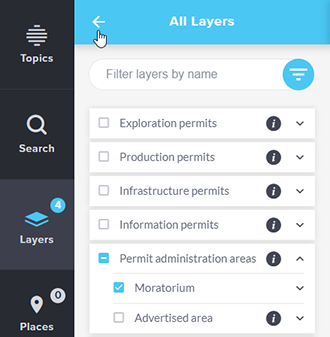
Once a relevant layer is turned on you can then discover further information about the layer by clicking the back arrow next to “All layers”.
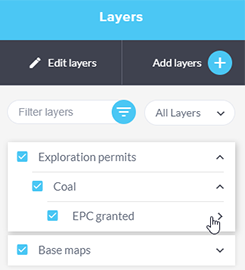
Click on the right facing arrow for the required layer.
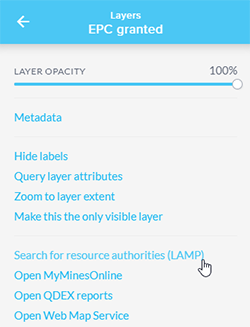
Click on the ‘Search for resource authorities (LAMP)’ link.
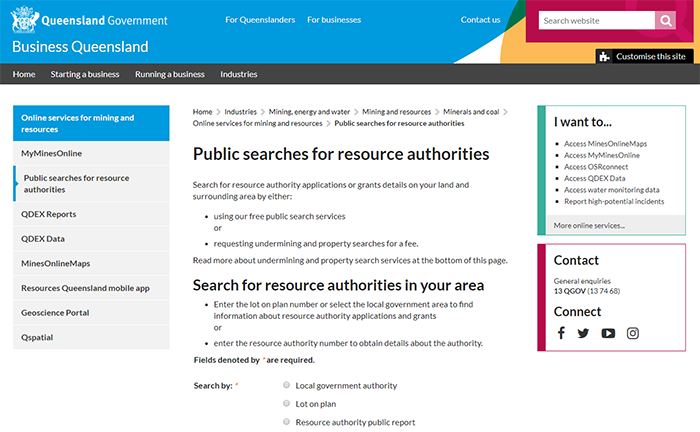
The Public searches for resource authorities page opens in a new browser window or tab. Follow the instructions listed to perform a search for your chosen resource authority.
Create a Moratorium Area report
A Moratorium Area report lists all sub-block within a moratorium area for a particular date.
To access these reports, ensure the following layers are added to your map:
- Moratorium area mineral
- Moratorium area special
These can be added by clicking Layers → Add Layers → Permit Administration Areas, checking the Moratorium group and then clicking the left arrow at the top left of the panel.
For further instruction on adding data refer to the following resources:
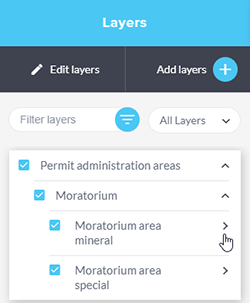
In your layers list, click the right arrow next to your required Moratorium layer (ie mineral or special).
Select the Moratorium Area Report link.
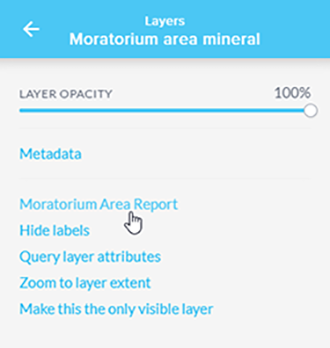
The Moratorium Area Report window appears. Then click Generate Report.
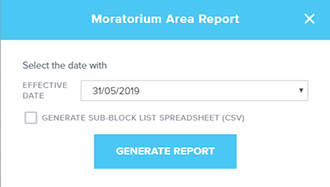
Select an Effective Date from the list, and if needed, check the box to generate a sub-block list in csv format.
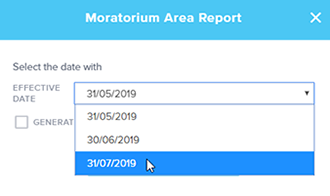
Then click Generate Report.
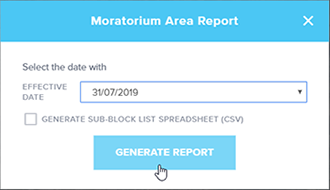
A PDF is then generated with the relevant block and sub-block information and a csv file as well, if you chose that option.
Access a SmartMap for a property
You may wish to access SmartMap to obtain current information on property boundaries, valuations and sales data, and survey information.
To do this, first ensure the layer Cadastre (DCDB) parcels has been added to your map.
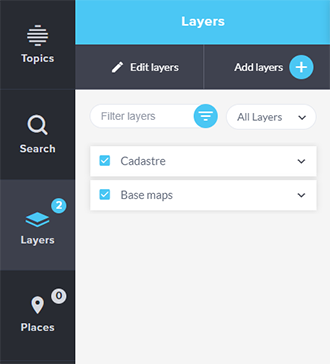
Then click on the Layers button to open the Layers panel, and click Add layers.
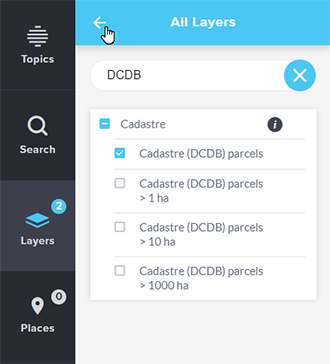
The All layers panel appears. Narrow the layer list by typing in DCDB into the Filter layers box and hitting enter. Click the box next to Cadastre (DCDB) parcels, and then click the back arrow to return to the Layers panel
Once the DCDB layer has been added, you need to view the attributes of the property you are interested in. One method is described below.
First, zoom to your property of interest.
If you know the location, you can do this using the map navigation tools.
If you have the Lot and Plan of the property, select Search → Lot on Plan.
Enter the Lot and Plan number and click on the result, to zoom to it on the map.
Once you have your chosen property on the map, select the Identify point tool from the Toolbar, and click on the property.
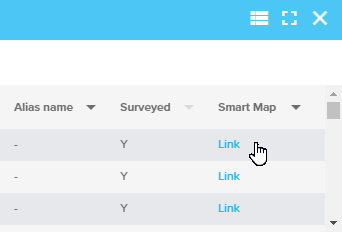
The Results table will display. Click on the Cadastre (DCDB) parcels tab to view the results.
Locate the Smart Map field in the table and click on the link
Create a survey control mark report
A survey control report provides coordinates, height, accuracy notes sketch plan and other administrative information for permanent survey marks.
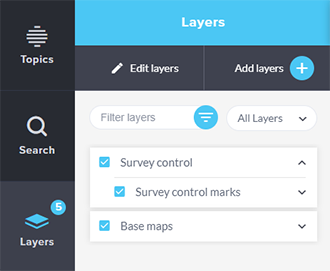
To create a survey control mark report, ensure the Survey Control Mark group layer is added to your map and turned on.
To do this, Click Layers → Add layers
Filter by Survey control marks
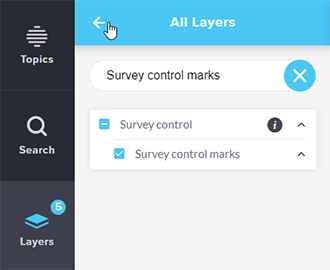
Check the Survey control marks box, and click the back arrow to return to the Layers panel.
You will need to then view your chosen survey mark’s attributes either in the Results window or the side panel.
There are many ways to obtain the attributes including running an:
- Identify
- Attribute query or
- Spatial query
For instruction on these methods, refer to these resources:
For this example we’ll use the Identify tools and the Results window.
If needed, zoom to your area of interest on the map.
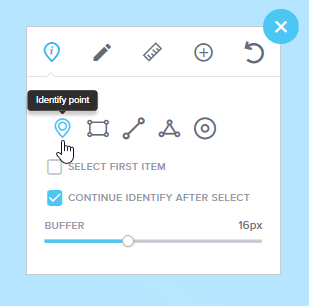
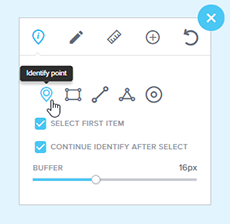
Then select the Identify point tool from the toolbar and click the Select first item checkbox
Click on a survey control mark on the map.
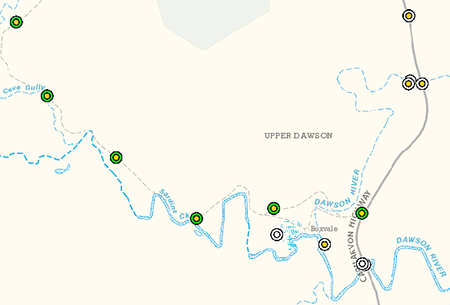
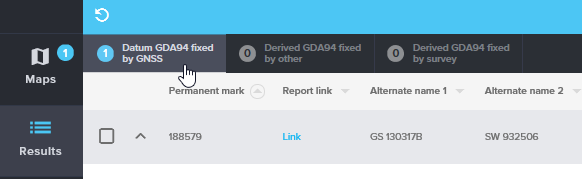
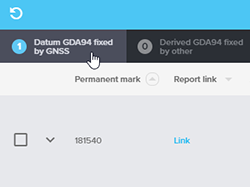
The Results table will display. Click on the relevant tab then click on the Report link
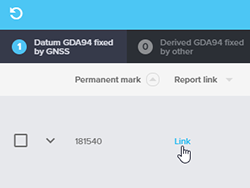
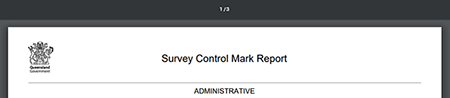
The link to the survey control report will open in a new web page
Generate a PDF short report of a feature’s attributes
A short report of a feature’s attributes can be generated from the Results table.
If needed, run a query or identify action to populate the table, as described in the below documentation and tutorials:
- How to query a layer’s attributes (help item)
- How to query layers intersecting a feature or place (help item)
- Searching and querying (video tutorial)
Wait...
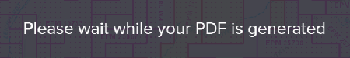
Your PDF will be downloaded for viewing (example given for Chrome browser)

Review your PDF. If multiple features were selected, each one will appear on a new page.
How to access MyMinesOnline
You are able to access MyMinesOnline from the following layers within the application:
- Exploration permits
- Production permits
- Infrastructure permits
- Information permits
- Historic exploration permits
- Historic production permits
- Historic infrastructure permits
Using the Layers tab on the left hand side menu bar, click on Add layers.

Add one or many layers from the list above and/or any of their related layers.


Once a relevant layer is turned on you can then discover further information about the layer by clicking the back arrow next to All layers.
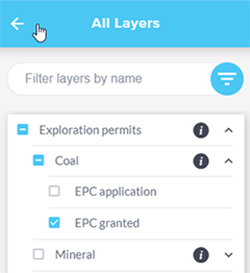
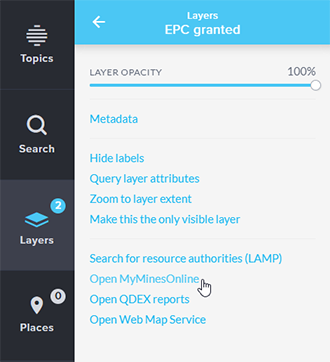
Click on the right facing arrow for the required layer
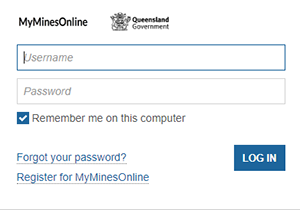
Click on the Open MyMinesOnline link to open the MyMinesOnline login page in a new tab in your browser.
Where can I access more information?
- QTOPO online topographic maps
- QImagery aerial photograph library
- QSpatial Queensland spatial catalogue
- QSpatial Quicklinks for geoscience data
- GSQ Open Data Portal open file geoscience data and reports