Managing layers
The GeoResGlobe provides easy access to hundreds of data layers for you to incorporate within a map.
To view the layers panel, select the Layers icon from the sidebar.

The layers from the default topic are included in the initial map view. You can replace or add to these layers using the the following options:
- Select Add layers to add layers from the table of contents
- Launch a Topic to add a group of layers
- Include your own data files, or link to external webservices via the Add My Data tool
- Add georeferenced imagery layers via the Past imagery tool
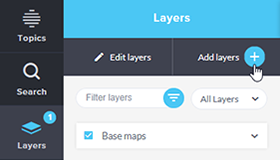
Add layers
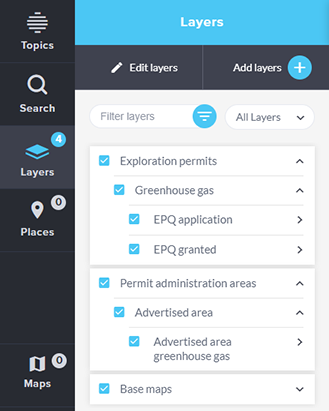
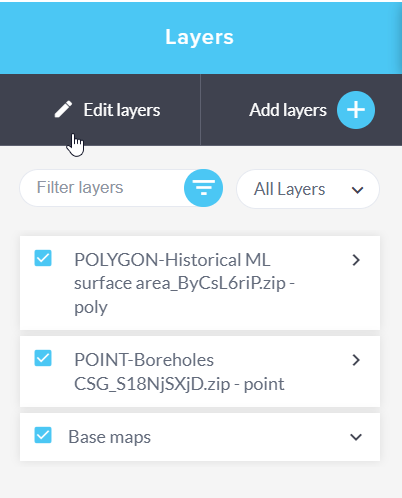
Click the Layers button to open the Layers panel. This shows all active layers currently in your map. Then click Add layers to view the full list of datasets, in the All layers panel.
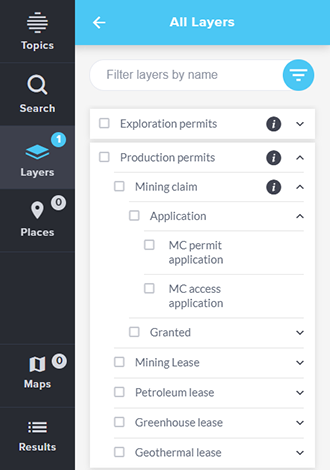
Note that the data is grouped into categories, which can be expanded by clicking the down arrow. Some categories have sub-categories you can expand as well.
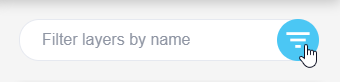
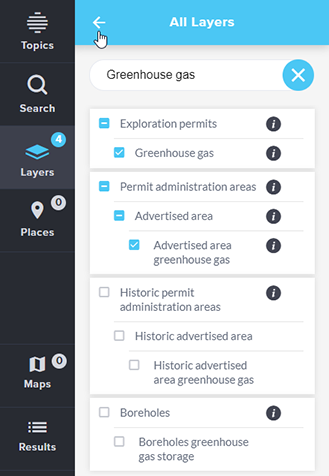
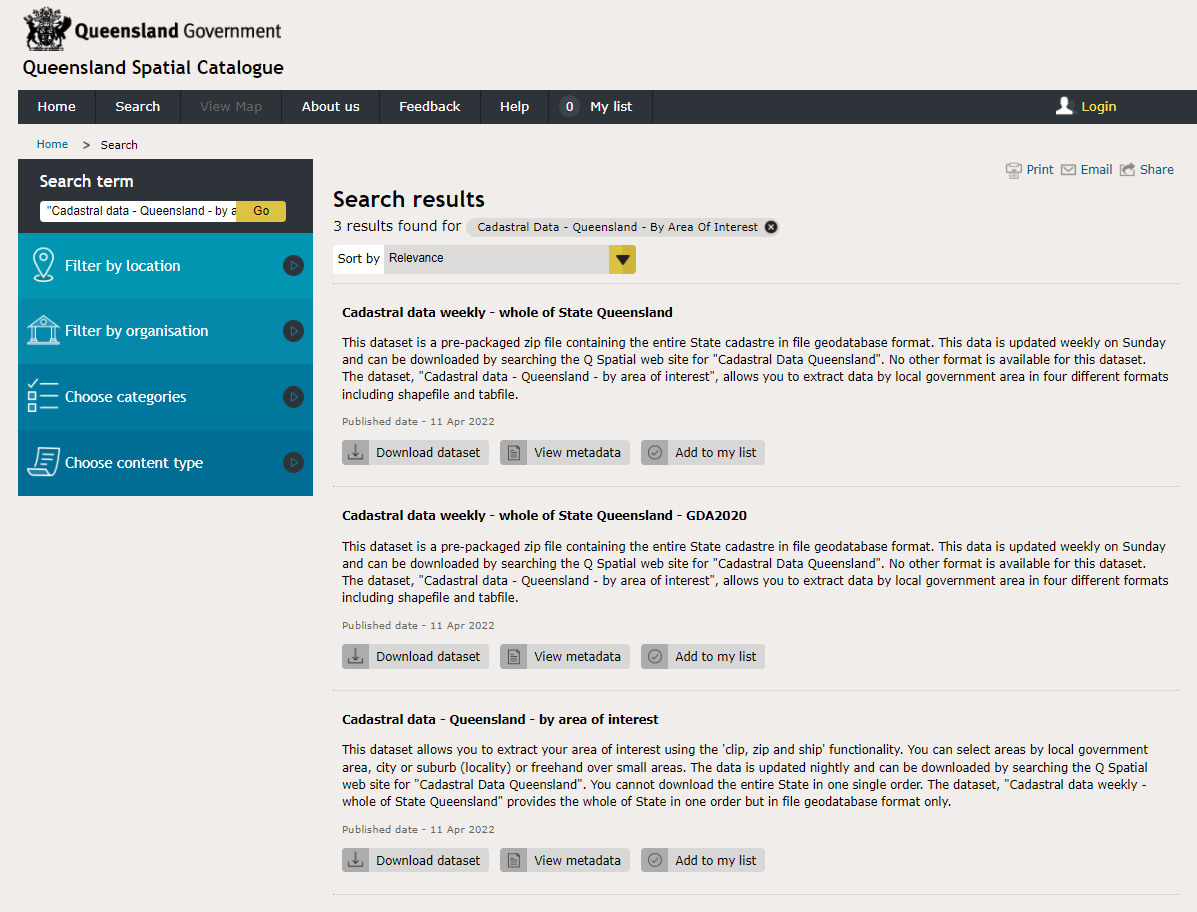
From here, you can manually browse the list to find layers or interest; Or you can filter the list by using all or part of a layer’s name. Just enter some text into the Filter layers by name box and press enter or click the filter icon.
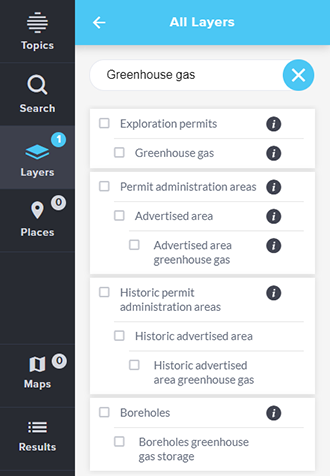
All layers, groups and sub-groups that contain the term or phrase will be returned For example:
- 'Geo' will return all names containing this term, such as Geothermal, Geology, Detailed surface geology and Georgina Basin
- 'Greenhouse gas' will return Greenhouse gas, Advertised area greenhouse gas and Historic advertised area greenhouse gas
Once you have found a layer you want to add to your map, check the box next to its name. (Note that the group headings will highlight with a dash, when something in that group is selected, or highlight with a tick if every layer in the group has been selected).
To add a whole group or sub-group to the map, just check the box next to that group or sub group.
Repeat the process until you have all the layers you need. Then click the back arrow to return to the Layers panel.
All your selected layers should now appear in the list. You may need to expand the group using the down arrows to see your chosen layers. Also note that some layers may be greyed out, meaning they are not visible at the current scale. Zoom in to a larger scale to make these layers visible.
Remove layers
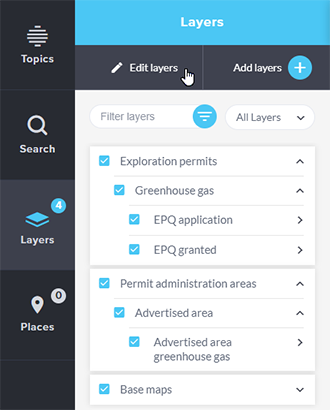
To remove one or more layers from your map, open the Layers panel and select Edit layers.
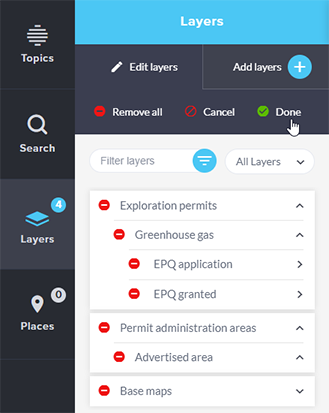
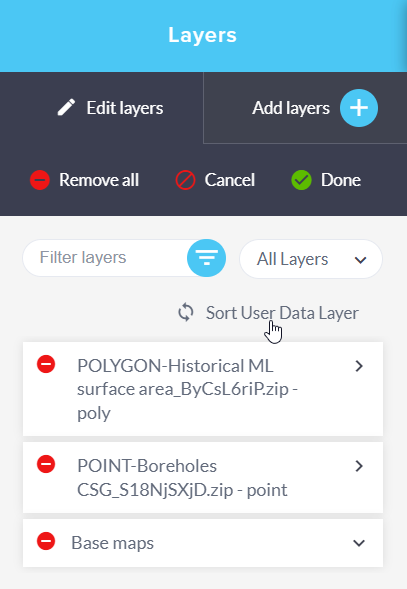
Click the red Remove icon next to all layers or groups you wish to remove.
Otherwise click Done to finish.
Reordering user-added data layers
When user-added data files are added, the order of these layers can be altered within the Layers panel. The sequence of the layers influences how they are displayed on the map, which is determined by the order specified by the user.
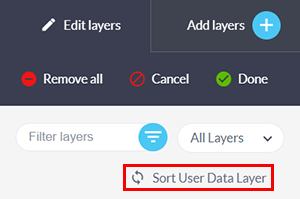
This option will only appear after 'Edit layers' has been selected.

It permits only the re-arrangement of user-added data layers.
- Select 'Sort User Data Layer'.
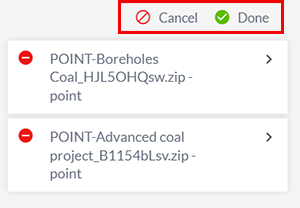
- Only the layers available for re-arrangement will be shown.
- Drag and drop the layers into the desired sequence in the Layers panel.
- Selecting 'Cancel' will revert any changes that were initiated.
- If 'Done' is selected after the layers have been re-arranged, any modifications will be incorporated into the Layers list.
- The order applied will be reflected in the map.
Known limitations:
Configured layers added via the Add layers or via a Topic cannot be re-arranged.
Web services cannot be reordered within GeoResGlobe, this is not possible due to the hierarchical representation of the layers.
User-added data will always be displayed at the top of the Layers panel.
View metadata
To access the metadata link for an added layer, expand the layer to view the available options and select Metadata.
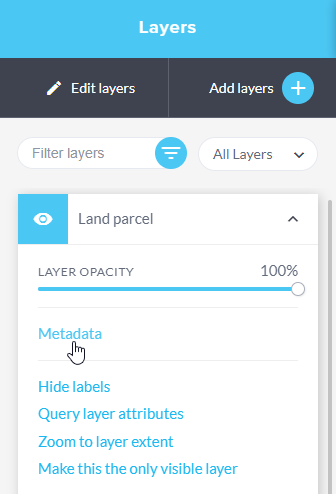
This will open the relevant website in a new browser tab.
Layer visibility
| Visibility | Description |
|---|---|
| Visible option is selected, the layer is visible in the current map extent. | |
| Hidden option is selected. This will turn the layer off on the map without having to remove it. | |
 |
Visible option is selected but the layer is invisible at the current scale. |
 |
Sets this layer as the only visible layer. |
 |
Zooms in to an extent where the data is visible. This option is available for layers that are visible or hidden. |
 |
Displays all layers in the layer panel. |
 |
Lists all of the layers in the layer panel that are set as visible. |
 |
Lists all of the layers in the layer panel that are set as hidden. |
 |
Lists all of the layers in the layer panel that are active. |
 |
Lists all of the layers in the layer panel that are inactive. |
 |
List all layers that have been added via the Add My Data tool. |
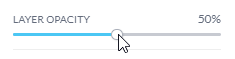 |
Move the point along the layer opacity slider to adjust the opacity setting. |
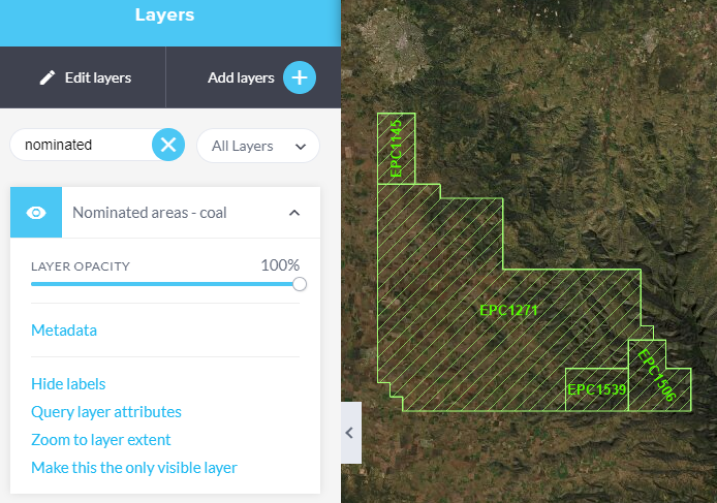
Turn layer labels on and off
Labels can be shown or hidden for all layers that contain labelling. This also includes layers added via the Add My Data tool, such as shape files and map or feature services.
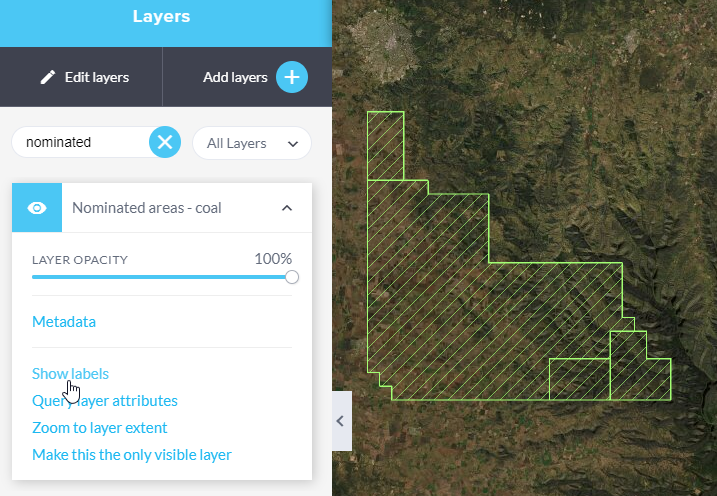
Select the Layers button to open the layers panel.
Navigate through the list to your required layer, and click on the arrow next to it to expand the options for that layer.
![]()
For all layers except shp, csv, kml and json, select Show labels or Hide labels as needed.
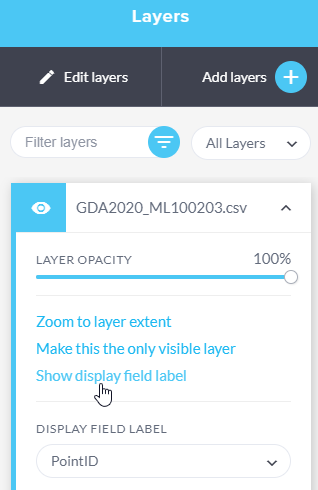
For added data files (shp, csv, kml and json) first choose your display field label, then click Show display field label.
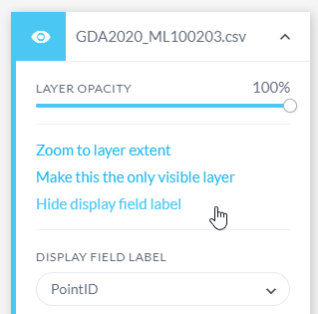
Selecting Hide display field label option will hide the labels in the map view.
The DISPLAY FIELD LABEL dropdown menu provides a list of the available fields that can be used to generate the label.
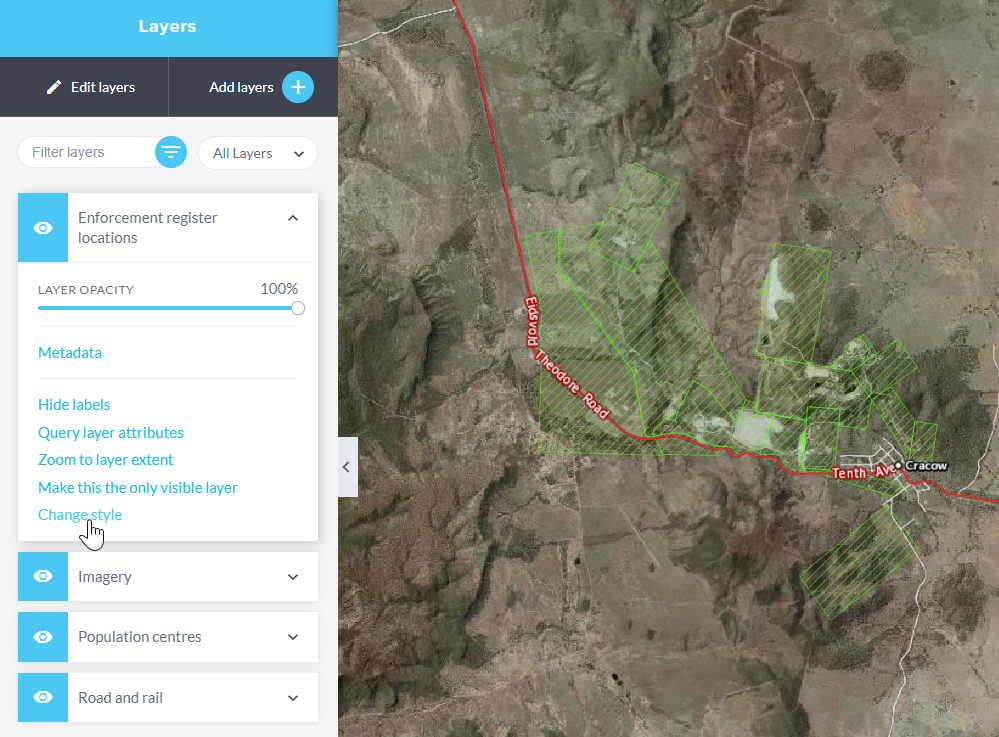
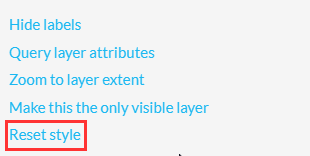
Change style
The Change style tool has the following functionality:
- Editing layer symbology: Users can edit the appearance of feature and map service layers using this tool. This includes options such as modifying fill colours, stroke (outline) colours, adjusting fill opacity, and other visual properties. This feature allows users to customise how the geographic data is displayed on the map.
- Availability varies: The availability of this option is not universal across all layers. Please check the layer details to see if this tool is available for a particular layer. If the tool is available, it can be used to adjust the layer's visual properties. If the layer does not support this tool, it will not appear as an available option.
- Retention of style settings: When users make changes to the style of a layer and then save the layer within a map, the new style settings are retained. This means that the customised appearance of the layer will be saved with the map, and these changes will be visible whenever the map is opened again.
To modify the appearance of a layer, follow these steps:
- Expand to view the layer details and select Change style.
- Adjust the symbology for the layer, as required.

Select the Reset style to revert the layer's symbology to the default symbology.
Sort user data layer
When user data files are added, the order of these layers can be altered within the Layers panel using the Sort user data layer option. Adjusting the order of the layers will be reflected on the map.
- This option will only appear after Edit layers has been selected.
- This tool is supported for user added files only.
- Configured layers added via the Add layers or via a Topic cannot be re-arranged.
- User-added data will always appear at the top of the Layers panel.
- This feature is available on touch screen devices, but is not a supported on mobile.
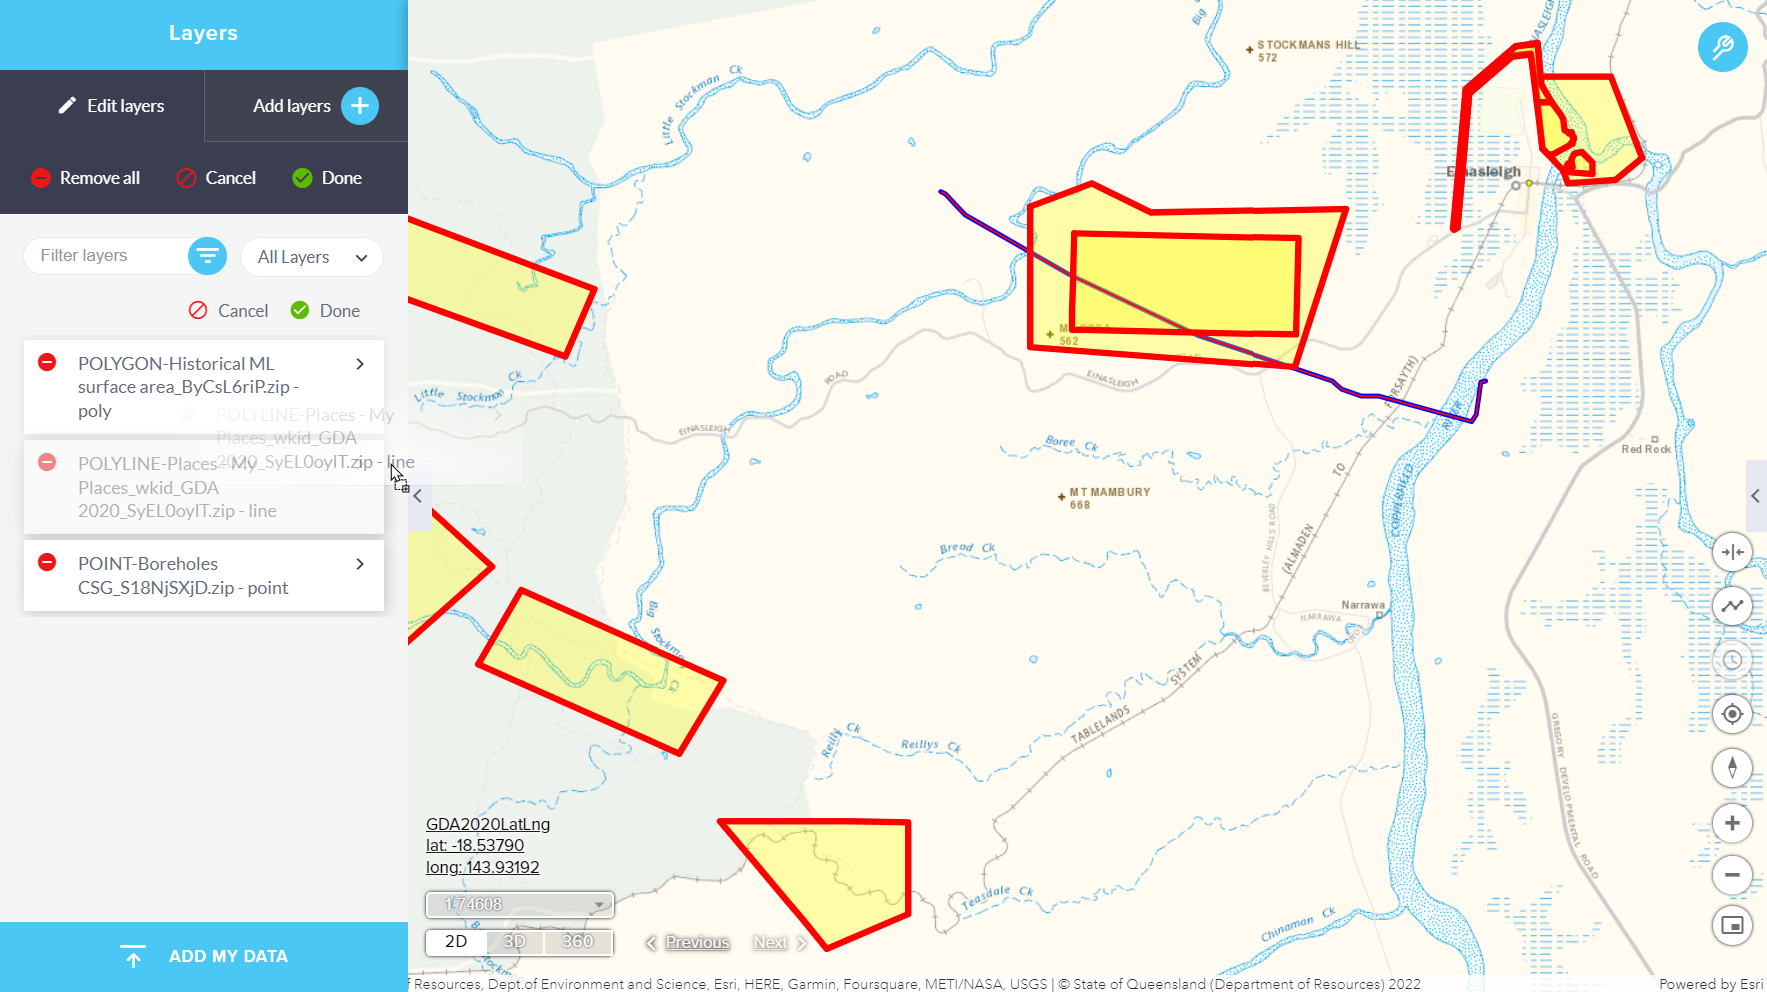
To re-order layers that have been added from user-added files:
- Add the user-added data files to the map.
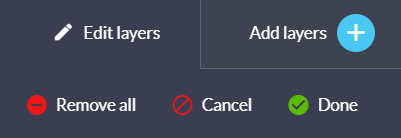
- Select Edit layers
- Select Sort user data layer
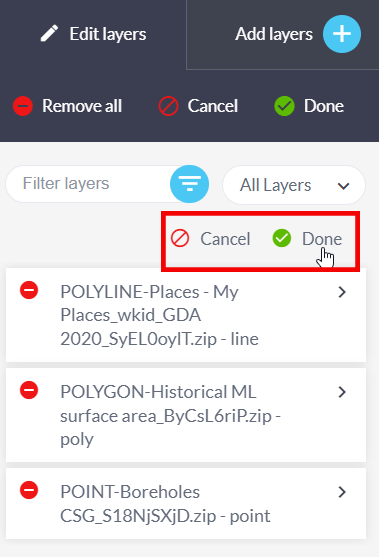
- When this option is selected, it will only display the layers that can be re-ordered in the Layer panel. Drag and drop the layers into the required order.
- Select Done to accept the changes.
- Alternatively, you can select Done for editing the layers and the changes will be applied.
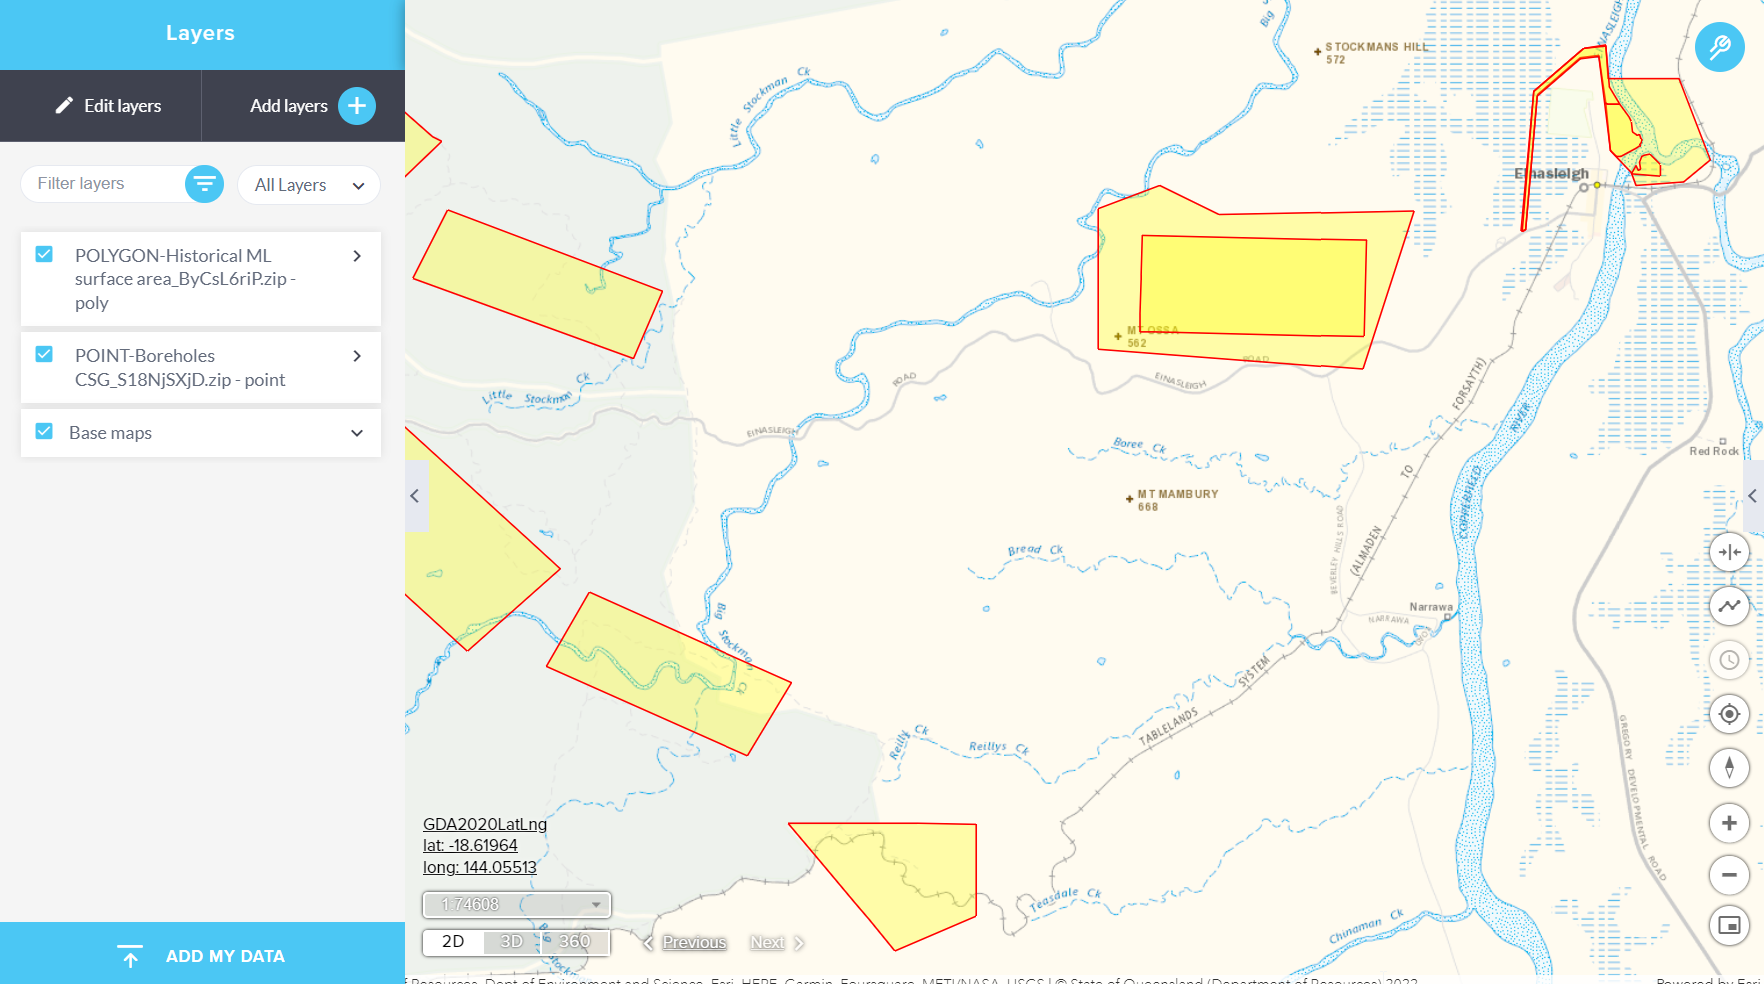
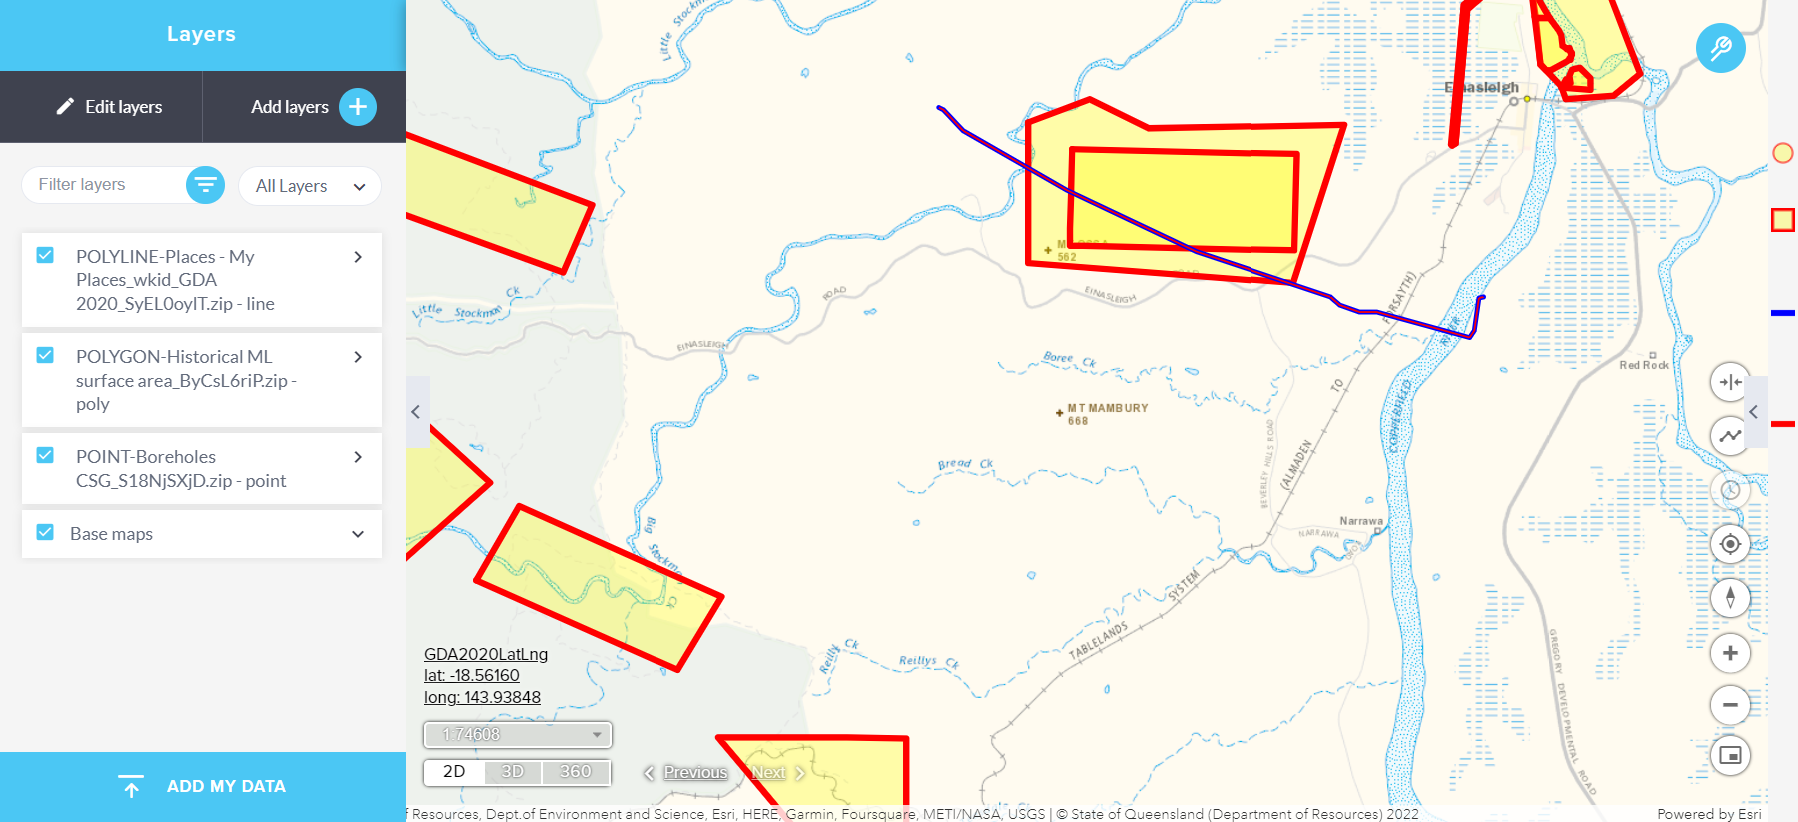
- In this example the layer containing the line feature was moved above all others. You will notice that this will affect the display order on the map.
Layers for 2D & 3D features
When user-added data files contain a mixture of 2D and 3D features, the application now separates them into different layers. These layers are categorized based on the feature type and whether the layer contains 2D or 3D features. To distinguish between these layers, a prefix is added to the layer name, indicating the feature type. If a layer contains 3D features, the prefix may include 3D.
The elevation mode dropdown menu for user-added data file layers is selectively displayed. It appears only for layers that contain 3D features.